
Key takeaways
- Bullish momentum intact above 24,535 key support despite recent profit-taking in mega-cap tech stocks.
- AI-driven optimism continues to fuel upside, supported by massive investments from Nvidia and Oracle into OpenAI.
- Positive market breadth as more Nasdaq 100 stocks are trading above 20- and 50-day moving averages.
- Next resistance zones at 24,890, 25,010/25,100, and 25,160/25,270.
The price actions of the US Nasdaq 100 CFD Index (a proxy of the Nasdaq 100 futures) have continued to soar and have printed three consecutive fresh all-time high closing highs since 18 September 2025.
The recent bout of risk-on behaviour has been attributed to the AI-driven productivity narrative embraced on Wall Street. AI juggernaut Nvidia has announced $100 billion worth of investments into OpenAI to support new data centres and other artificial intelligence infrastructure. Interestingly, this latest significant AI-related deal came after Oracle surprised Wall Street last week with a whopping $300 billion deal with OpenAI.
On Wednesday, 23 September 2025, the major US stock indices pulled back as profit-taking emerged in mega-cap technology names. The Nasdaq 100 led the decline, slipping -0.7%, while the S&P 500 lost -0.5%. The Dow Jones Industrial Average and small-cap Russell 2000 fared relatively better, each easing -0.2%.
Is this the start of a deeper, multi-week corrective decline for the US Nasdaq 100 CFD Index? Let’s break it down accordingly to its latest technical analysis elements, short-term trajectory (1 to 3 days), and relevant short-term key levels to watch.
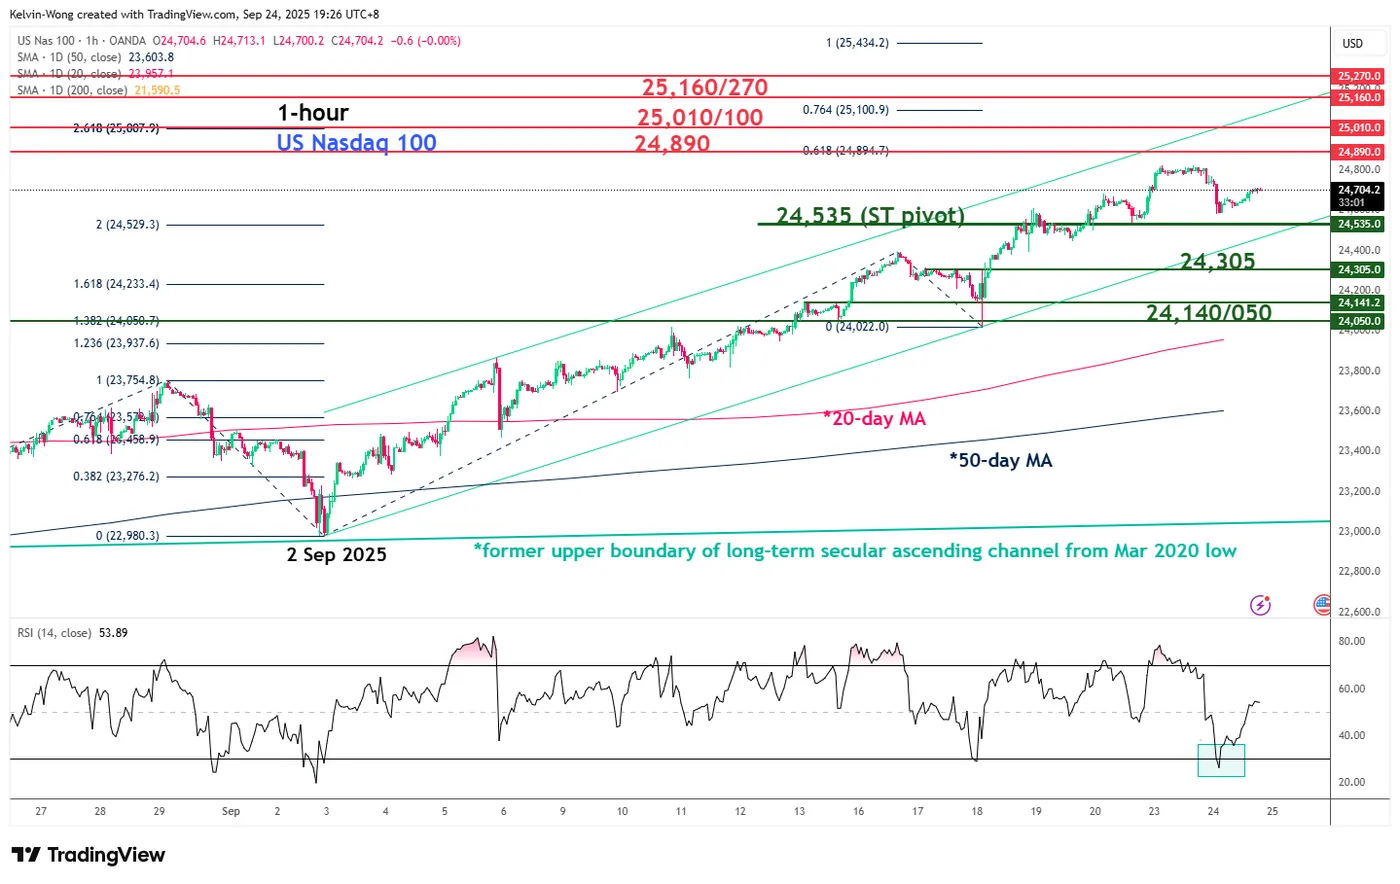
Fig. 1: US Nasdaq 100 CFD Index minor trend as of 24 Sep 2025 (Source: TradingView)
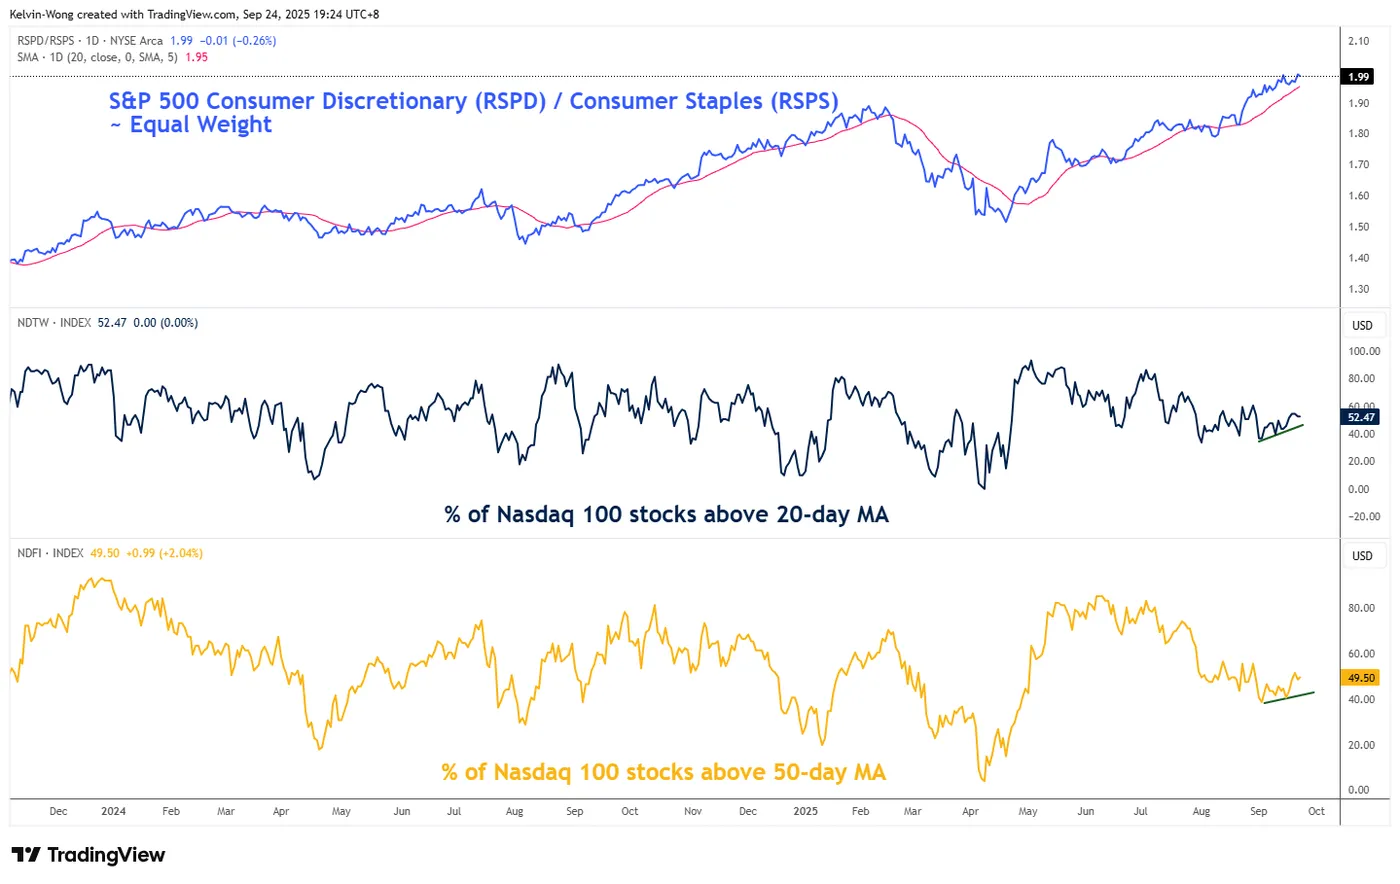
Fig. 2: Market breadth of Nasdaq 100 (% of stocks above 20-day/50-day MA) & relative performance of equal-weighted S&P 500 Consumer Discretionary sector ETF against equal-weighted S&P 500 Consumer Staples sector ETF as of 23 Sep 2025 (Source: TradingView)
Preferred trend bias (1-3 days)
The short-term minor uptrend phase of the US Nasdaq 100 CFD Index remains intact from the 2 September 2025 low of 22,979.
Bullish bias above 24,535 short-term pivotal support for the next intermediate resistances to come in at 24,890, 25,010/25,100, and 25,160/25,270 (Fibonacci extension cluster) (see Fig. 1).
Key elements
- The price actions of the US Nasdaq 100 CFD Index have continued to trade above its 20-day and 50-day moving averages. These observations support a short-term and medium-term uptrend phase for the US Nasdaq 100 CFD Index (see Fig.1).
- The lower boundary of the minor ascending channel of the US Nasdaq 100 CFD Index confluences closely with the 24,535 short-term pivotal support (see Fig.1).
- The hourly RSI momentum indicator has just exited from its oversold region (below the 30 level), which indicates that yesterday’s bearish momentum has eased (see Fig.1).
- Market breadth remains positive in the Nasdaq 100 as the percentage of Nasdaq 100 component stocks trading above their respective 20-day and 50-day moving averages has increased steadily from 2 September 2025 to 23 September 2025 (% of stocks above 20-day moving averages jumped from 37% to 52%, and % of stocks above 50-day moving averages increased from 41% to 50% (see Fig.2).
- The higher beta equal-weighted S&P 500 Consumer Discretionary sector ETF has continued to outperform the defensive-oriented equal-weighted S&P 500 Consumer Staples sector ETF. This observation supports a bullish reversal scenario in the US Nasdaq 100 CFD Index (see Fig.2).
Alternative trend bias (1 to 3 days)
Failure to hold at the 24,535 key short-term support on the US Nasdaq100 CFD Index jeopardises its short-term minor uptrend phase to open scope for a deeper minor corrective decline sequence towards the next intermediate supports at 24,305 and 24,140/24,050 (also the rising 20-day moving average) (see Fig. 1).


