
The Euro has been very tenacious throughout the year.
It is currently the top two in major currency performance this year, with only its neighbor, the Swissie, keeping it in check (the difference in performance between the two is very small).
Trends can be expected to continue, particularly when they reverse flows that have been seen in the past 10 years. So, what has been going on with the Euro since the 2010s?
The Euro was in a secular downtrend against the US Dollar, for example, due to lower growth, a disadvantageous trade balance, companies fleeing the overregulated economic zone, generally lower rates (implying basis trade activity), and some not-so-nice events like the Greek debt crisis.
This year, however, the Joint currency bounced back, with a more united Europe against external menaces (e.g., Russia, economic tensions against the US amid their de-globalization moves), and promises to provide more elastic regulations.
This took the Euro up close to 12.37% against the greenback at its prime.
However, some technicals may indicate that the strong uptrend is slowing down.
Let’s examine the Euro in detail—EURUSD, EURCAD, and EURCHF—to see if the current slowdown anticipates a pullback or if the move really is exhausting.
OAU-PRS-236-MarketPulse-variant2-Square
EURUSD
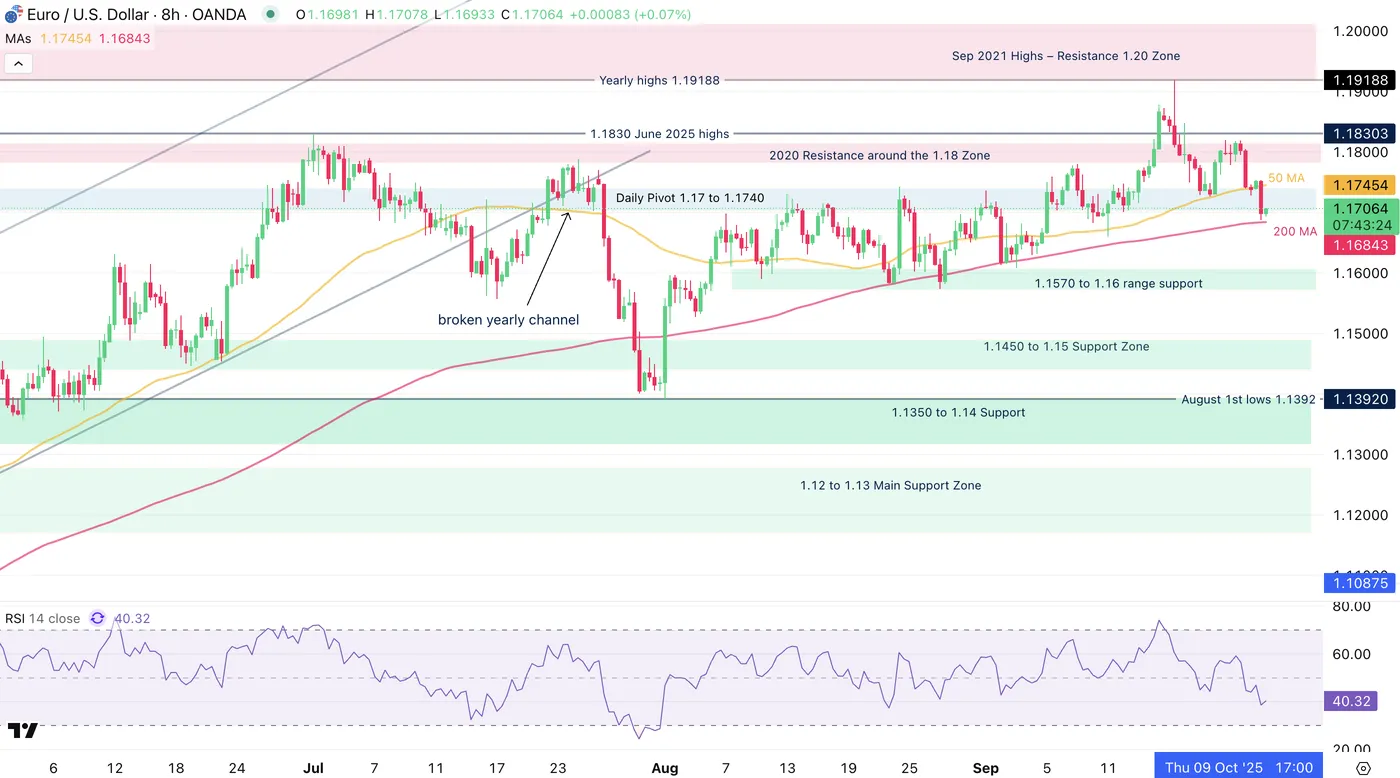
EURUSD 8H Chart, September 25, 2025 – Source: TradingView
The most traded major pair is seeing strong selling momentum in today’s session due to the ever-stronger US data.
Jobless claims and Q2 GDP just came in much better than expected which may take out some expected cuts for the FOMC – With rates at 4.25% in the US vs 2% for Europe, the yield differential is back higher and may drag demand in the pair.
The most recent 8H candle breached the 50-period MA and the key pivot zone, but the important part is to see what traders do now: The 8H 200-period MA was sustaining prices throughout every pullback since the 21st of August, taking the pair to new yearly highs.
However, the pair is down about 2,500 pips since reaching its peak ahead of last week’s FOMC event (1.19188).
With the 200 MA coming right in play, reactions will be very interesting to watch – A rebound here may lead to a retest of the 1.18 level, while a break of the 1.16 Support should lead to further downside.
Resistance Levels:
- Daily Pivot 1.17 to 1.1740 (50-period MA in confluence)
- Main resistance 1.18 to 1.1830
- 1.19188 yearly highs
- 1.20 psychological level and 2021 highs
Support Levels:
- 1.16840 MA 200 (immediate support)
- 1.1570 to 1.16 Main support
- 1.1470 Pivotal Support
EURCHF
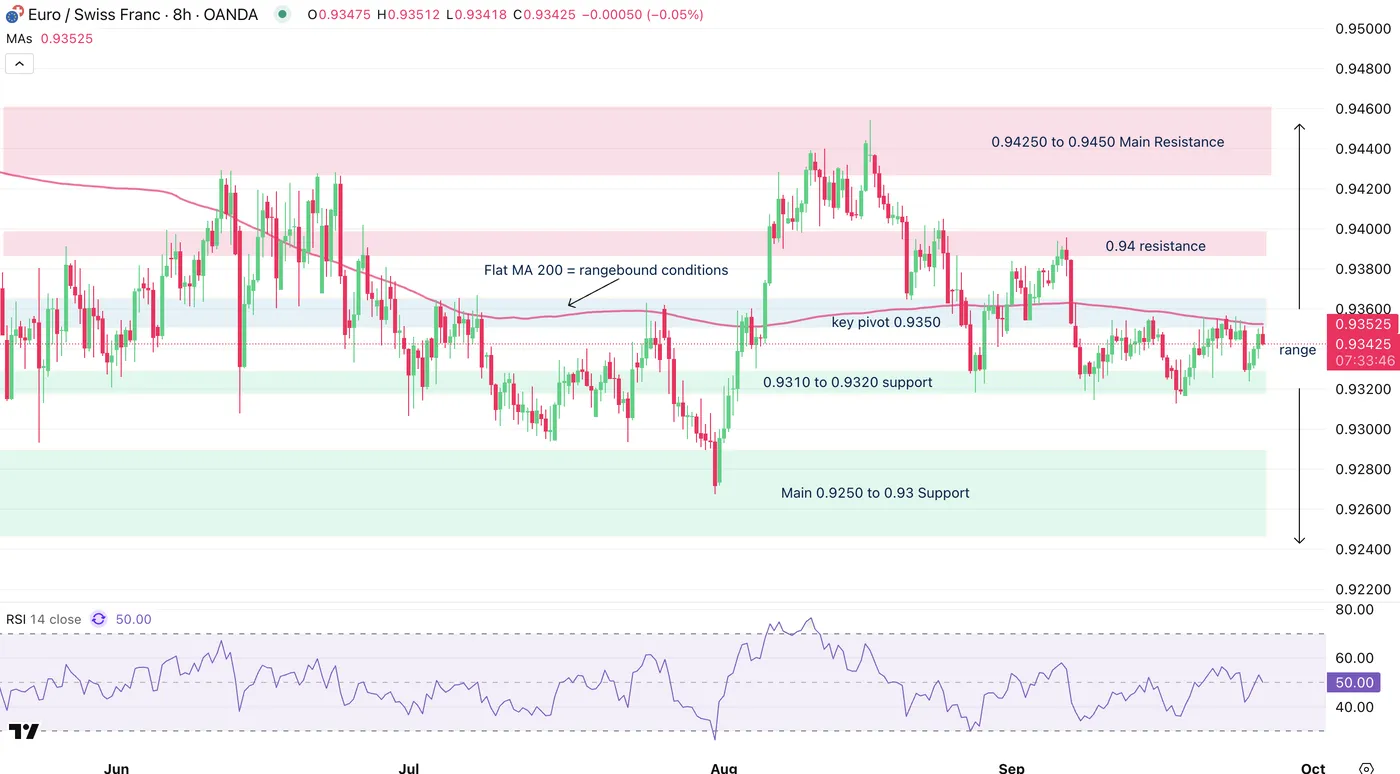
EURCHF 8H Chart, September 25, 2025 – Source: TradingView
EURCHF has a more rangebound tendency with few events that can create trends.
The latest one has been a down-move from March 2025 highs, as the Swissie was dragging more appeal amid a slowing economy and still tense geopolitics (with its safe-haven status getting strong attention – Gold was also very bid at that time).
A (fairly) recent piece looked at the CHF to see if its run could also be exhausting, and now we look at both strongest 2025 currencies to see which one still has the upper hand on the immediate outlook.
Having bounced thrice on its 0.9310 support but contained by the 200-period MA located within the key pivot (around 0.9350), any breakout from these two points should see further continuation (look for a weekly close above/below).
In terms of fundamentals, look at the appetite for Risk-off assets and relative hawkishness from the respective central banks (ECB wins that point).
Levels of interest for EURCHF trading:
Resistance Levels:
- key pivot 0.9350
- 0.94 key resistance
- 0.94250 to 0.9450 Main Resistance
Support Levels:
- 0.9310 to 0.9320 support
- 0.92675 last major lows
- Main 0.9250 to 0.93 Support
EURCAD
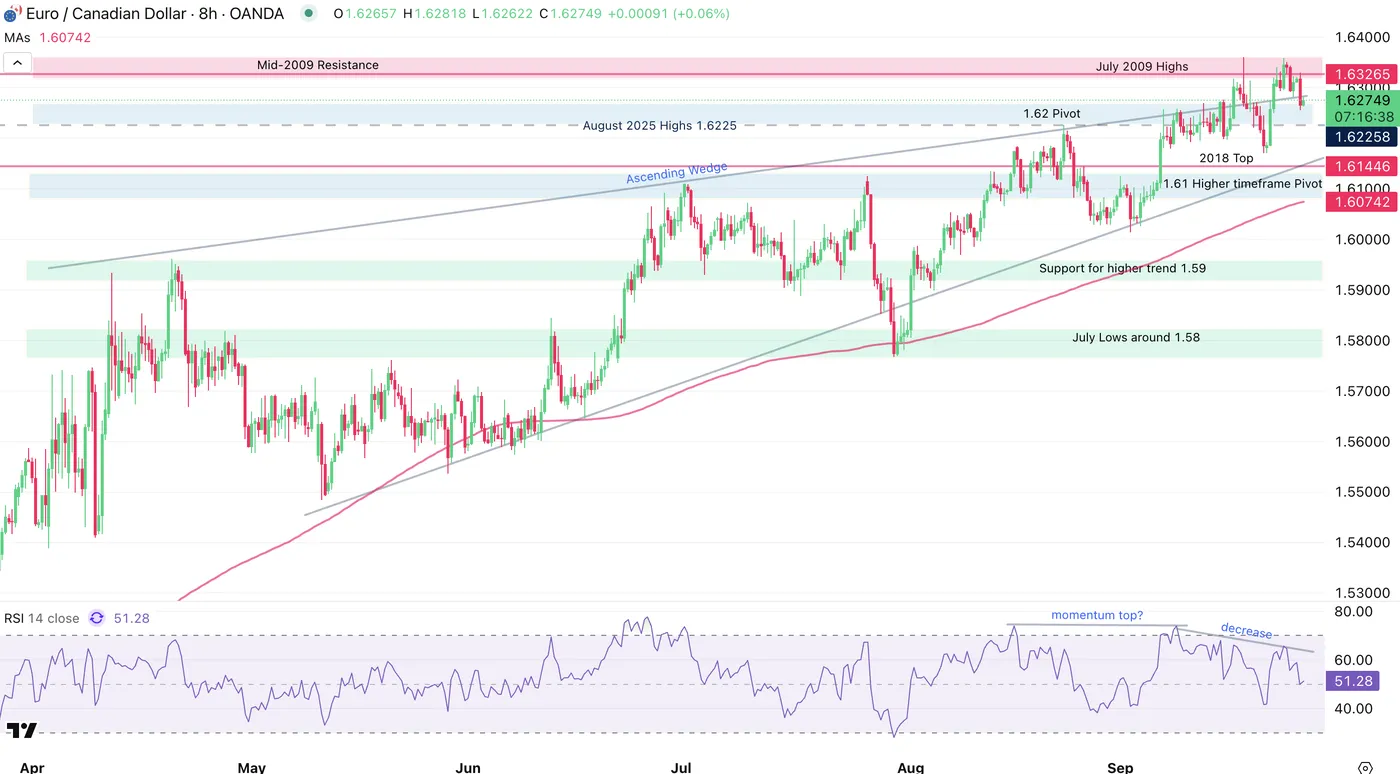
EURCAD 8H Chart, September 25, 2025 – Source: TradingView
To spot whether the rally in Euro against all other currencies is really over, I would suggest to look at EURCAD:
While the US Dollar weakened more rapidly in 2025, the trend in the Canadian Dollar is more persistent due to the weakening Canadian data and a still confusing US/Canada trade outlook.
Sending many tricky signs of reversals, dips quickly got met with sharp buying and new yearly highs in the pair got reached just two days ago (1.6350, unseen since 2009).
But, the pair is now evolving within an ascending wedge and bullish momentum is slowing down gradually.
Will this be enough for sellers to take control of the one way trend? Look at the reactions when prices reach the upward trendline or if the pair breaks out of the current 2025 highs.
Levels to place on your EURCAD charts:
Resistance Levels:
- 1.6350 Current yearly highs
- Mid-2009 Resistance (1.6320 to 1.6350)
- 1.63 psychological resistance
Support Levels:
- 1.62 immediate momentum Pivot
- 1.61 Higher timeframe pivot zone (confluence with rising trendline)
- Support for higher trend 1.59
- July Lows around 1.58


.)