
Traders are obsessed with trends.
Yet history shows that markets only trend about 30% of the time — the remaining 70% is spent consolidating sideways. This is valid for almost every asset class since the dawn of time.
But consolidation don’t necessary translates to frustrating, choppy action.
In 2025, the US Dollar has been at the center of global debate.
After months of weakness driven by tariff fears, slower US growth, and fiscal uncertainty, a bottom seems to have formed since July — confirmed by the pre-FOMC retest in mid-September.
But bottom doesn’t always mean reversal.
The much-discussed de-dollarization trend, for now, looks overstated.
Despite with less conviction than before, the world still largely trades in USD.
Instead of a sharp recovery, the greenback appears stuck in a large range as traders await new catalysts — whether from tariff policy, an unexpected change to the Fed’s stance, or new global economic trends.
This could have important implications for FX markets in all currencies.
Let’s take a close look at the Dollar Index (DXY) to spot what the range looks like and its key levels of interest.
Dollar Index mulit-timeframe analysis and levels
Daily Chart
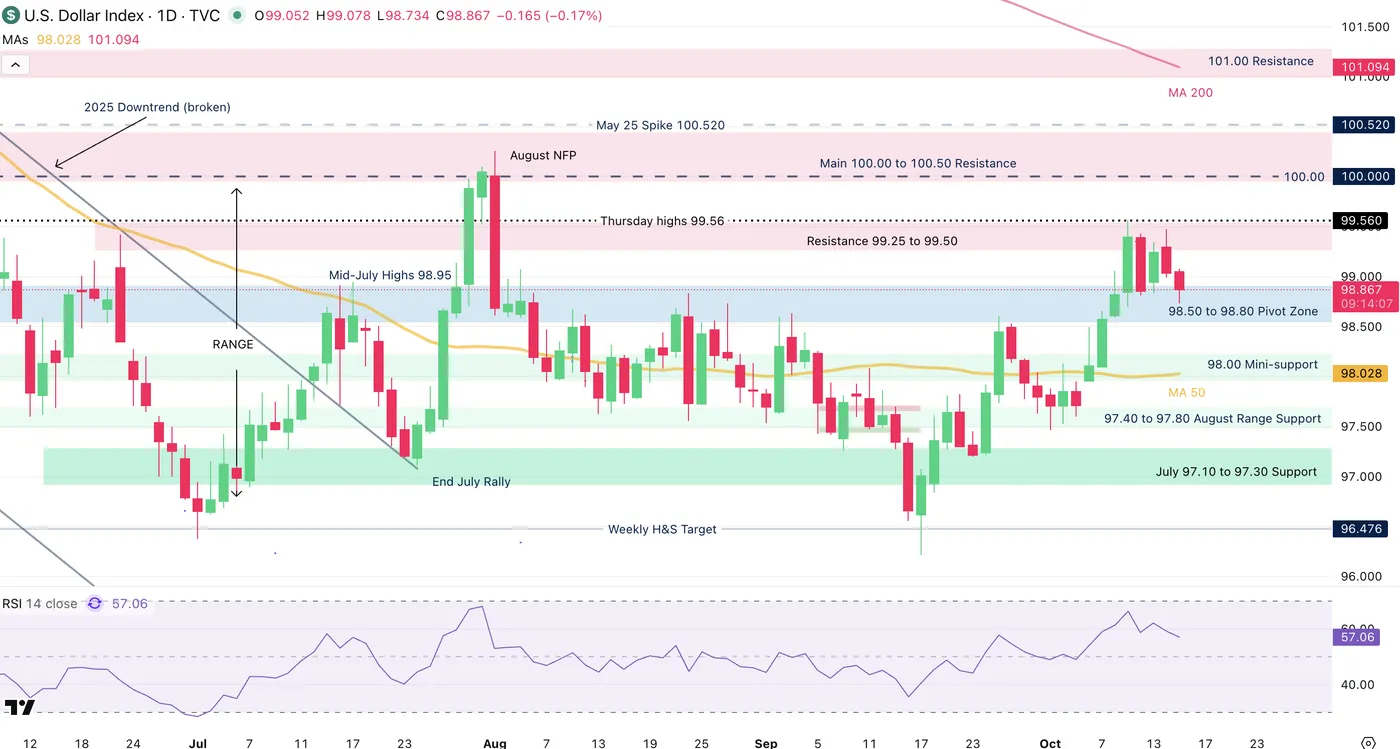
Dollar Index Daily Chart, October 15, 2025 – Source: TradingView
The Dollar Index recently broke the 99.00 handle, having done so for the first time since end-July.
However, with the ongoing uncertainty in markets, it seems that participants are not rushing to bid the greenback at its highs.
Reacting to a key technical resistance right around 99.50, sellers have appeared to correct the pair slightly which decreases the technical outlook for a sudden breakout.
Looking further out, the range is taking place between 97.00 to 100.00 with some +/- 500 pip precision.
USD/CAD is trading right around 1.40, USD/JPY rejected its higher levels and the Swissie is proving resilient around 0.80.
4H Chart and levels
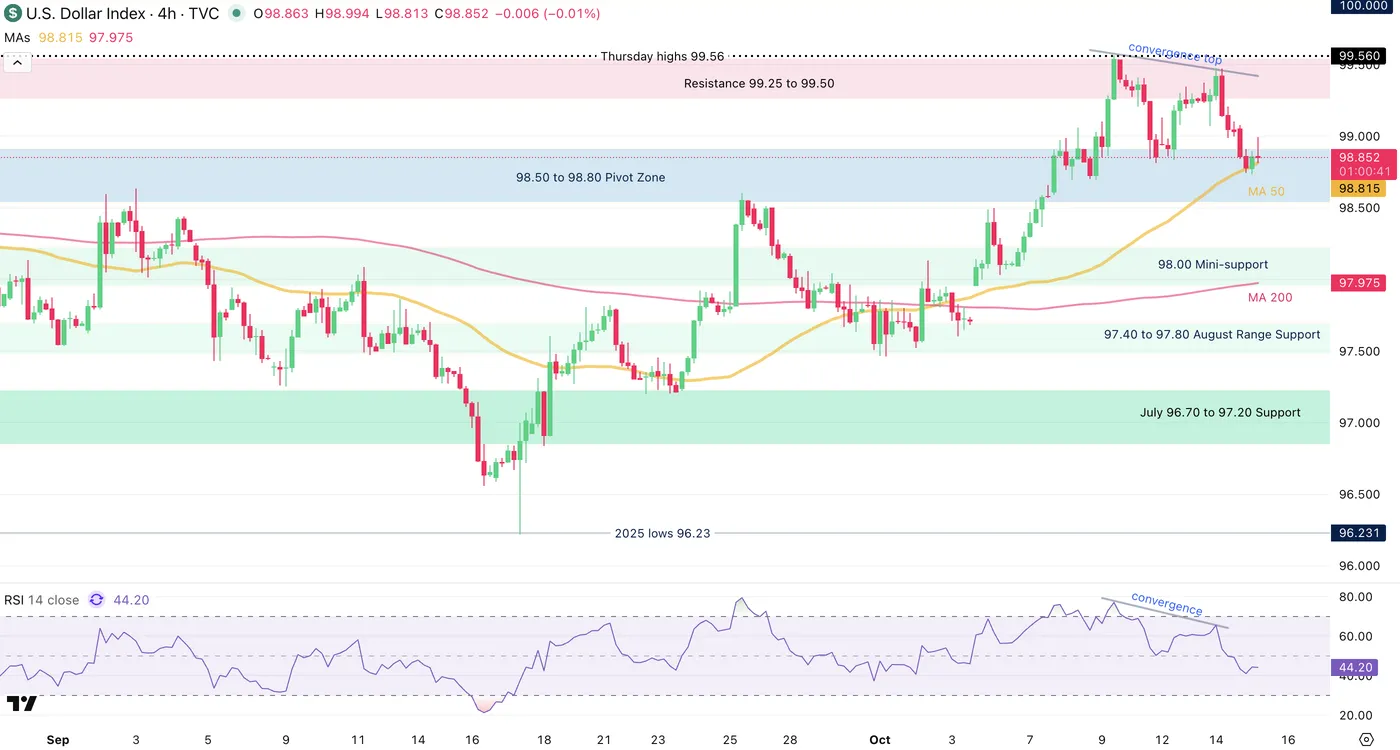
Dollar Index 4H Chart, October 15, 2025 – Source: TradingView
The DXY is reacting particularly well to overbought and oversold levels in the RSI as of late, and the pattern seems to repeat through different timeframes, a sign confirming the rangebound action further.
The 4H MA 50 (98.81) is still acting as support around the current 98.50 zone pivot restraining the selloff – Any breach below would confirm a re-entry in the range.
Levels of interest for the Dollar Index:
Support Levels:
- 98.50 to 98.80 Pivot Zone (with 4H MA 50)
- 98.00 Mini-Support
- August Range support 97.25 to 97.60
- 2025 Lows Major support 96.50 to 97.00
Resistance Levels:
- Resistance 99.25 to 99.50
- Thursday Oct 9 highs 99.56
- 100.00 Main resistance zone
1H Chart
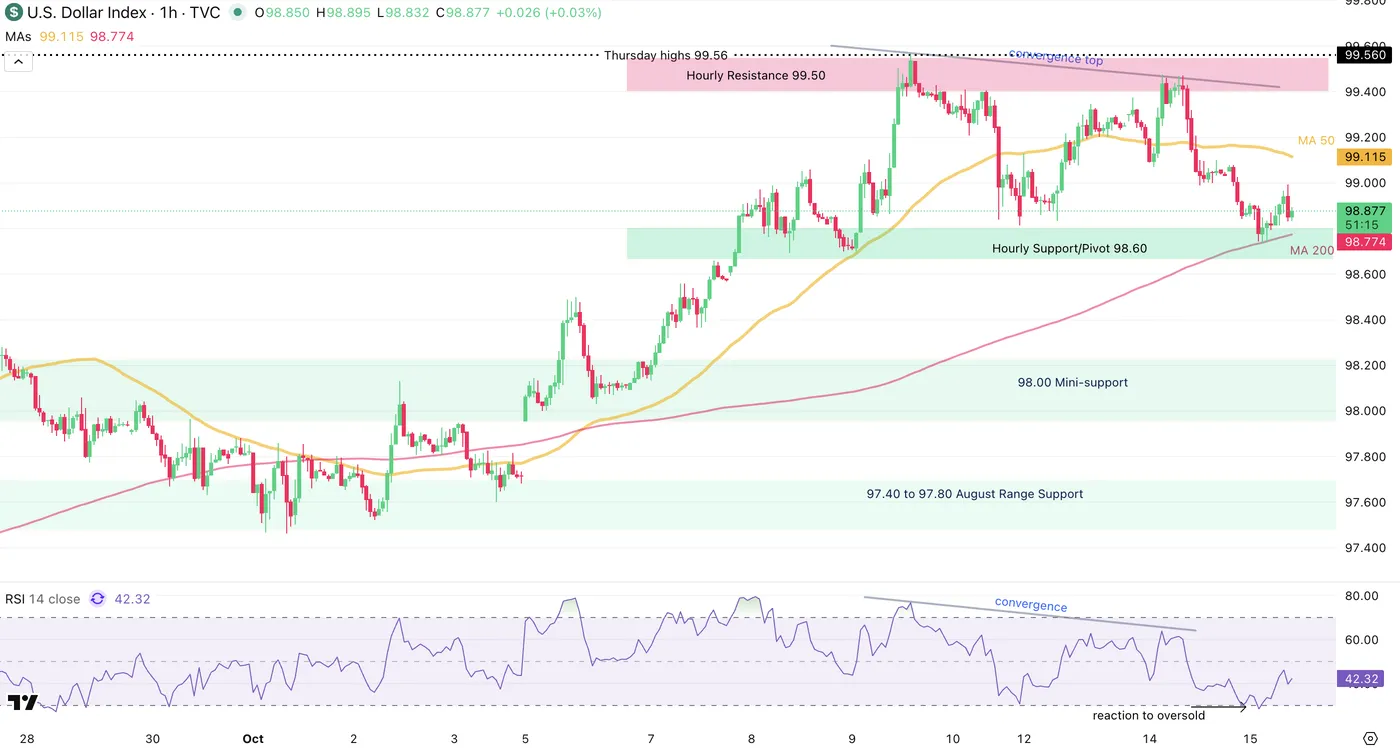
Dollar Index 1H Chart, October 15, 2025 – Source: TradingView
Looking even closer, small mean-reversion buying is occuring at the 98.60 hourly support but with the RSI approaching neutral, reactions will be essential to monitor.
Spot through the chart the ongoing mini-range between 98.60 and 99.50: Any break and close above/below should see continuation.
If rangebound conditions persist, attempt to spot how this could contain the price action in other FX pairs in the waiting of more fundamental catalysts.
Safe Trades!