
Precious metals haven’t dodged the volatility bullet hitting markets throughout the morning session.
Bleak and brutal overnight trading has failed to attract flows into normally in-demand gold, even as risk sentiment deteriorates sharply.
An unusual positive correlation between the yellow metal and equities is adding confusion about where capital rotates when these outflows occur.
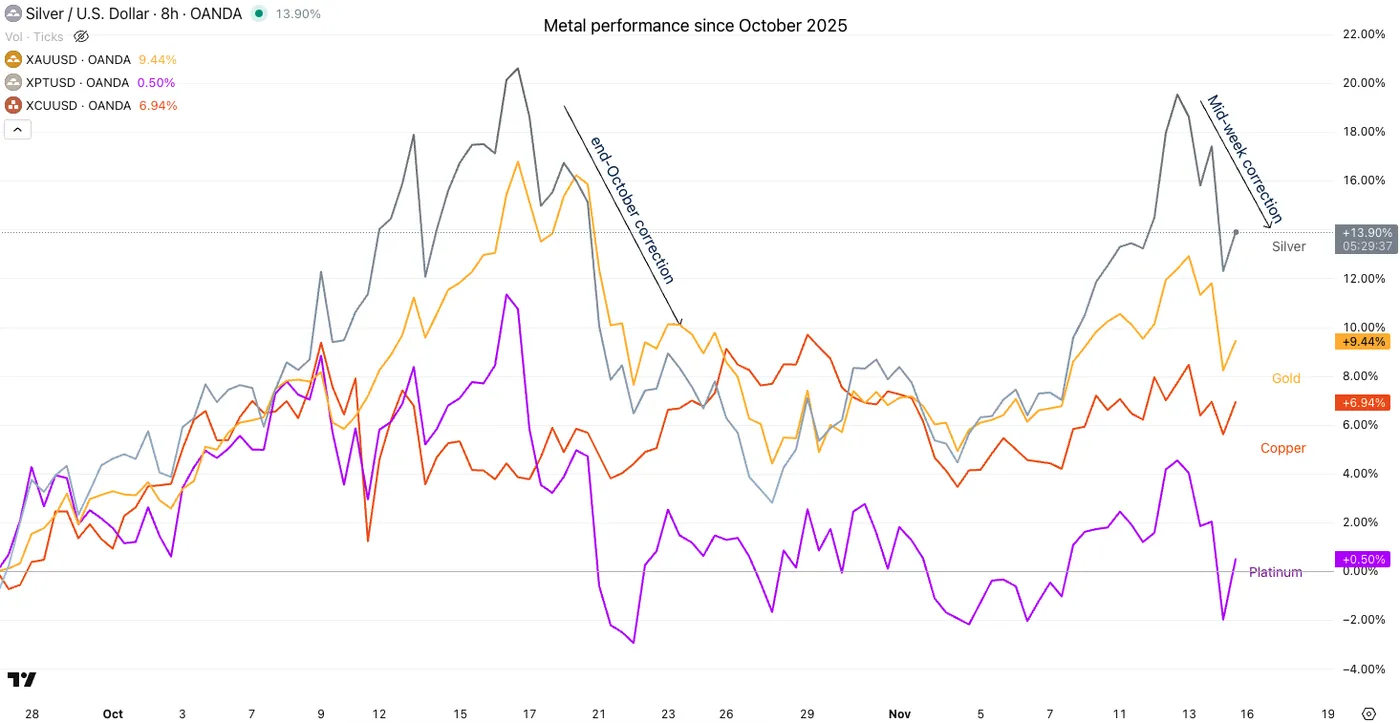
Metals performance since beginning October. November 14, 2025 – Source: TradingView
After dropping $150 at its morning lows, mean-reverting buyers dragged Gold prices back toward the $4,100 area, and are attempting to break through the psychological level.
With fresh volatility, lower highs are forming and the outlook is turning increasingly opaque.
So let’s dive into a multi-timeframe Gold analysis to see whether technical signals can help us determine where metal prices may be headed next.
Gold (XAU/USD) multi-timeframe technical analysis
Daily Chart
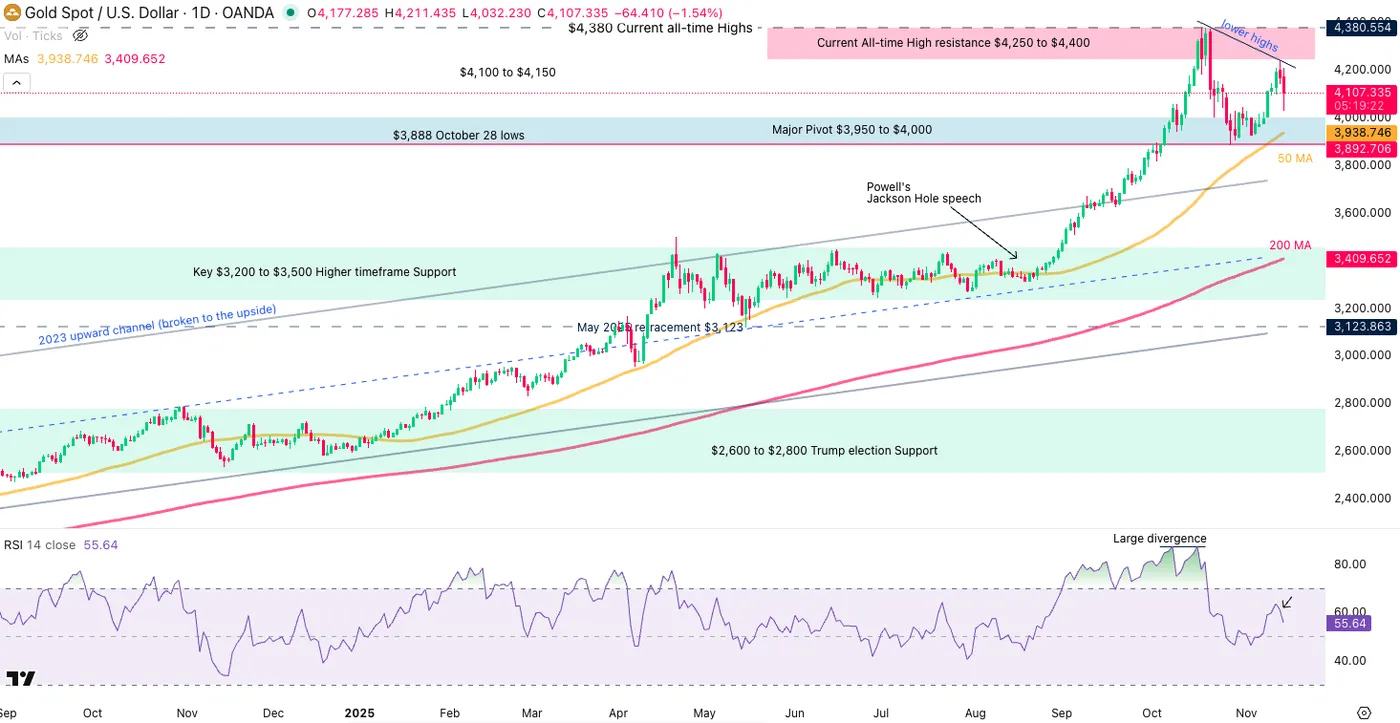
Gold (XAU/USD) Daily Chart. November 14, 2025 – Source: TradingView
After forming a gigantic bearish divergence at the end of last month, brutal outflows brought Gold well below the $4,000 mark.
Still, some strong dip-buying pushed the metal back higher as late-trend followers rushed for the “discounted prices”.
But discounts can be traps in markets.
Sole performer during yesterday’s bloody session, Gold found a top in a flash sale this morning, all the way to $4,030.
Now back above $4,100, the price action just looks more confusing on the Daily chart.
Long-wicked dojis like the one from today’s action can put out trade setups:
- Look at what happens if bulls manage to retake the daily highs at $4,211 (trend continuation)
- Vice versa if bears bring the pair to new lows (especially below $4,000)
4H Chart and technical levels
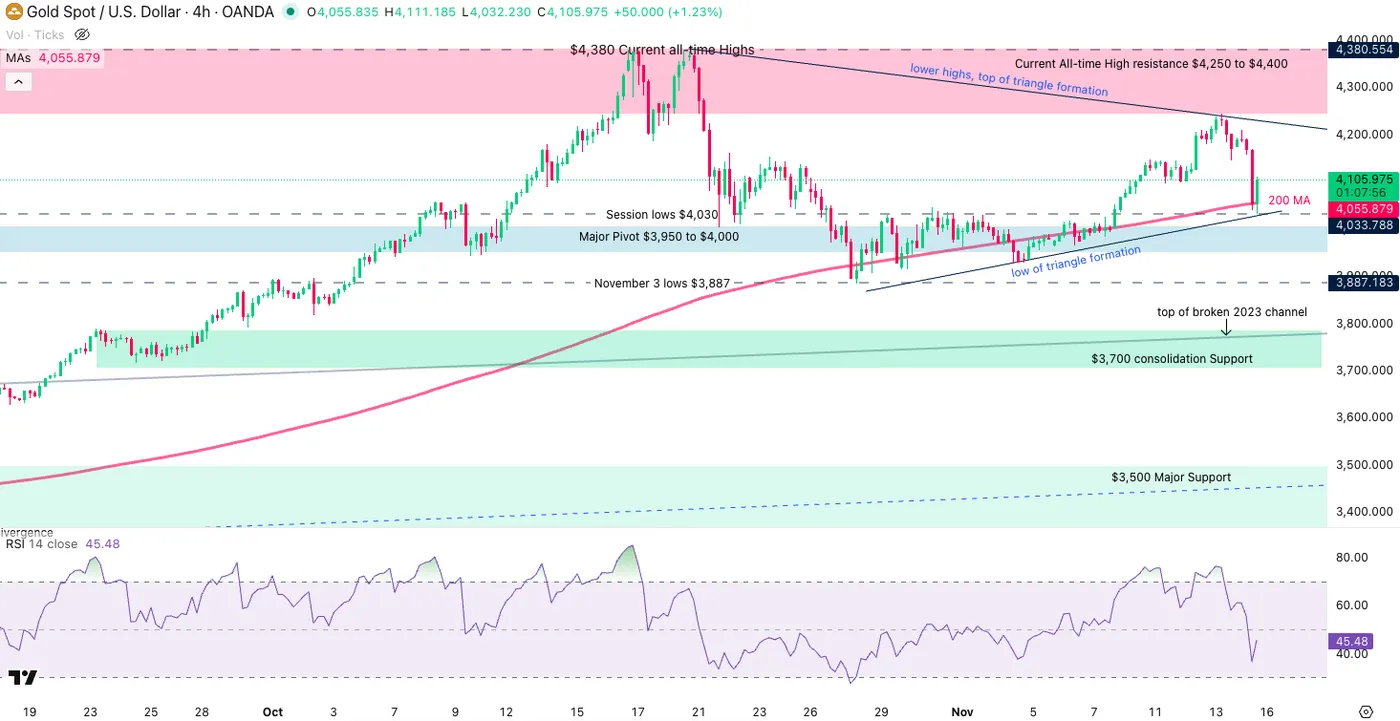
Gold (XAU/USD) 4H Chart. November 14, 2025 – Source: TradingView
Gold technical levels of interest:
Resistance Levels
- Current All-time High resistance $4,250 to $4,400 (ATH $4,380)
- Low of Resistance zone $4,250 and Triangle formation top
- Session highs $4,211
Support Levels
- 4H MA 200, Session and triangle formation lows: $4,030 to $4,050)
- Major Pivot $3,950 to $4,000
- $3,700 consolidation Support
- $3,500 Major Support
1H Chart
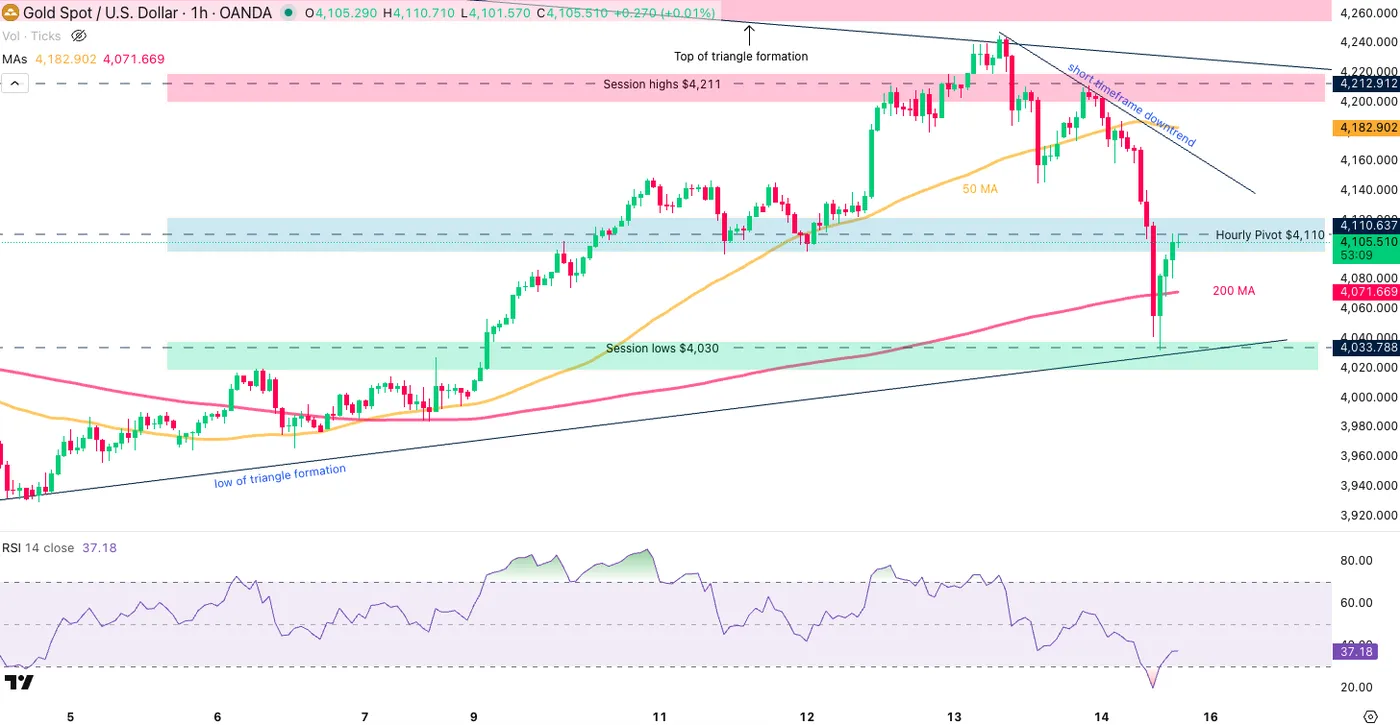
Gold (XAU/USD) 1H Chart. November 14, 2025 – Source: TradingView
It’s a bull and bear battle in today’s action, as expressed in the consolidation patterns seen through higher timeframes.
Buyers have broken the $4,100 but the momentum pivot stays around $4,110.
Closing above this level gives more odds for bull continuation towards the weekly close, while closing below the pivot gives back the hand to sellers.
Keep an eye on the triangle formation and watch the afternoon session closely to see if indecision follows or a side takes the wheel.
Safe Trades!