
Key Highlights
- Ethereum struggled to recover above $3,050 and trimmed gains.
- ETH is well below a key bearish trend line with resistance at $3,260 on the daily chart.
- Bitcoin price gained bearish momentum and settled below $90,000.
- XRP started a fresh decline after it struggled near $2.25 and $2.28.
Ethereum Technical Analysis
Ethereum started a recovery wave from $2,620. The bulls were able to push ETH above $2,800 and $3,000 before they faced hurdles.
Looking at the daily chart, the price remained well below the 100-day simple moving average (red). The bears defended the $3,050 resistance zone and the price even failed to test the 50% Fib retracement level of the downward move from the $3,655 swing high to the $2,616 low.
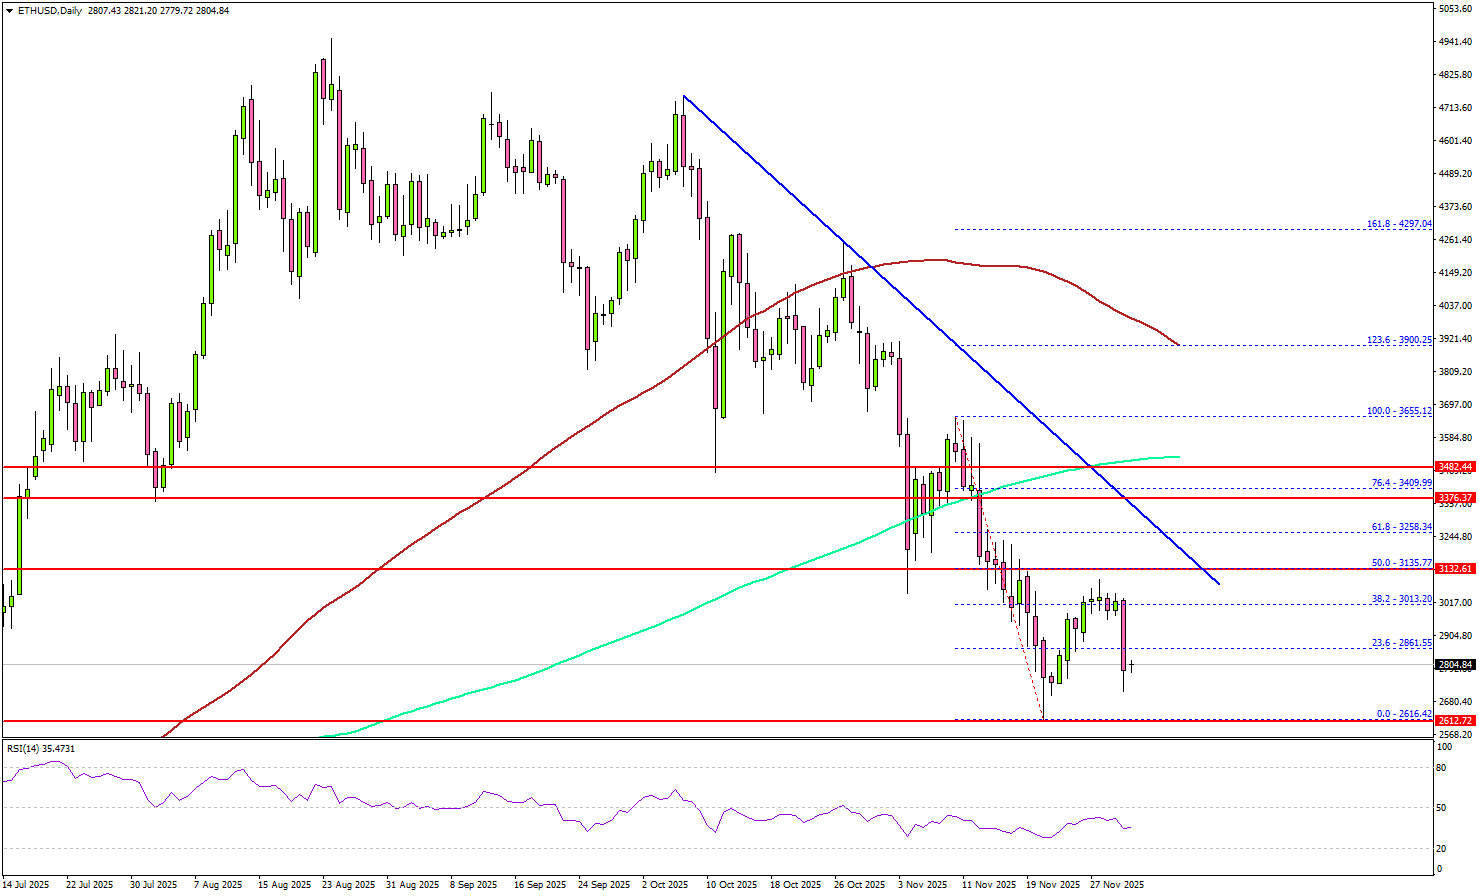
ETH is now well below a key bearish trend line with resistance at $3,260. The current price action suggests an increase in bearish pressure. If there is a recovery wave, the price could face resistance at $3,000.
The next major resistance is near the $3,050 level. The main resistance is now forming near the $3,250 zone and the trend line. A daily close above the $3,250 resistance zone could start another steady increase. In the stated case, the price may perhaps rise toward the $3,500 level.
On the downside, the bulls might be active near $2,680 and $2,640. The main support is now forming near $2,500, below which the price could slide toward $2,350. Any more losses might call for a move toward $2,200.
Looking at Bitcoin, there was a sharp decline below $88,000, and the bears seem to be aiming for more downside in the near term.
Economic Releases
- FPC Meeting Minutes.
- Fed’s Bowman speech.


