
Our preceding analysis on Silver could not have been more wrong.
With the FOMC approaching and bouts of up-and-down action across all metals, what we thought to be a temporary top leading to a potential range was, in fact, just a retracement.
And that retracement was an opportunity not lost on Silver traders: a stark run during month-end trading took the precious metal to new record highs, grazing the $58.85 level.
The dovish repricing for the Fed’s December 10 Meeting—main catalyst of the renewed “everything-rally” (or Debasement Trade) seen throughout stocks in the past week—was fuel for a sharp rally across the entire metals complex.
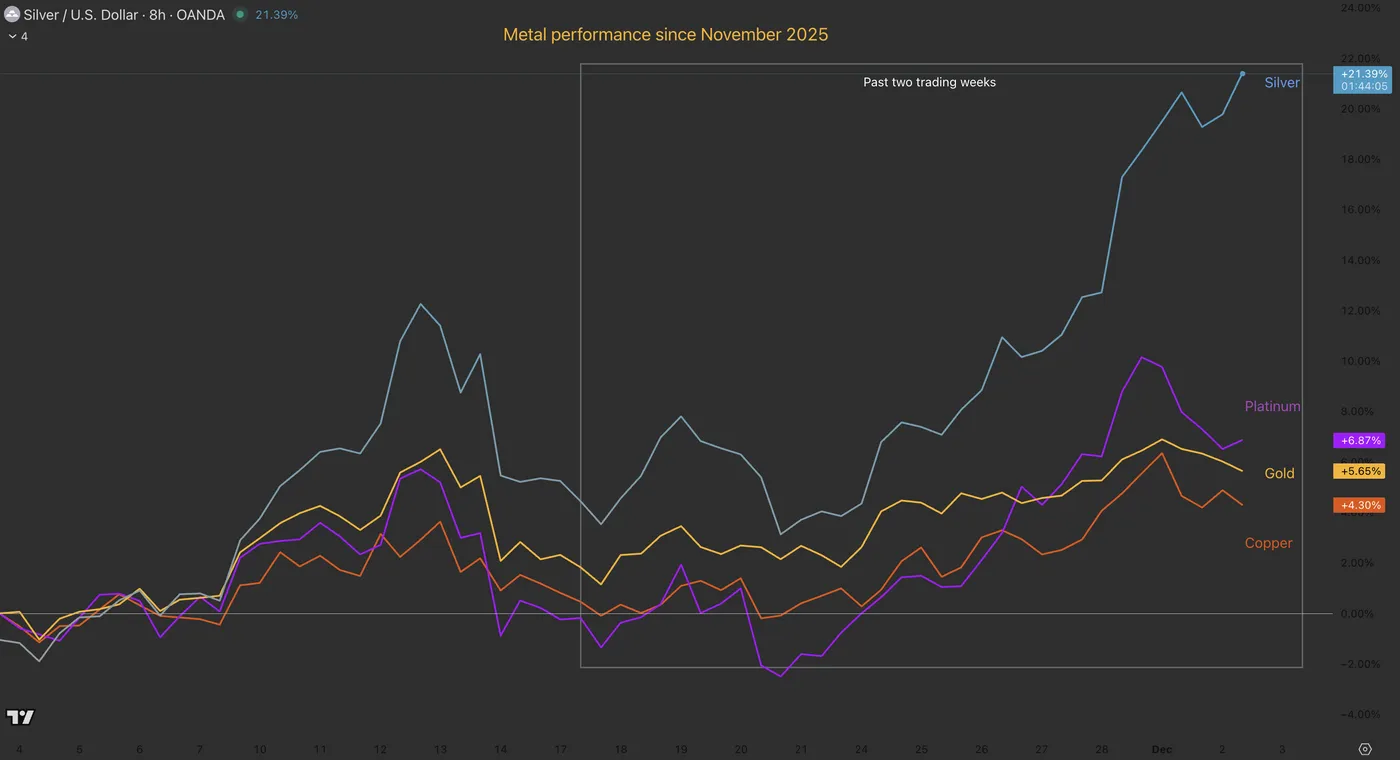
Metals performance since November 2025 – Source: TradingView
However, a distinct divergence has emerged in today’s session.
Gold, Platinum, and Copper have all rejected their recent highs established on Friday, correcting lower as traders book profits.
It is a different story for Silver, which is showing remarkable relative strength, hanging less than 1% below its $58.85 record and running towards its retest.
Will it keep rallying or is the move finally over? Let’s dive into the charts to see if this breakout has legs.
Silver (XAG/USD) Multi-timeframe Technical Analysis
Daily Chart
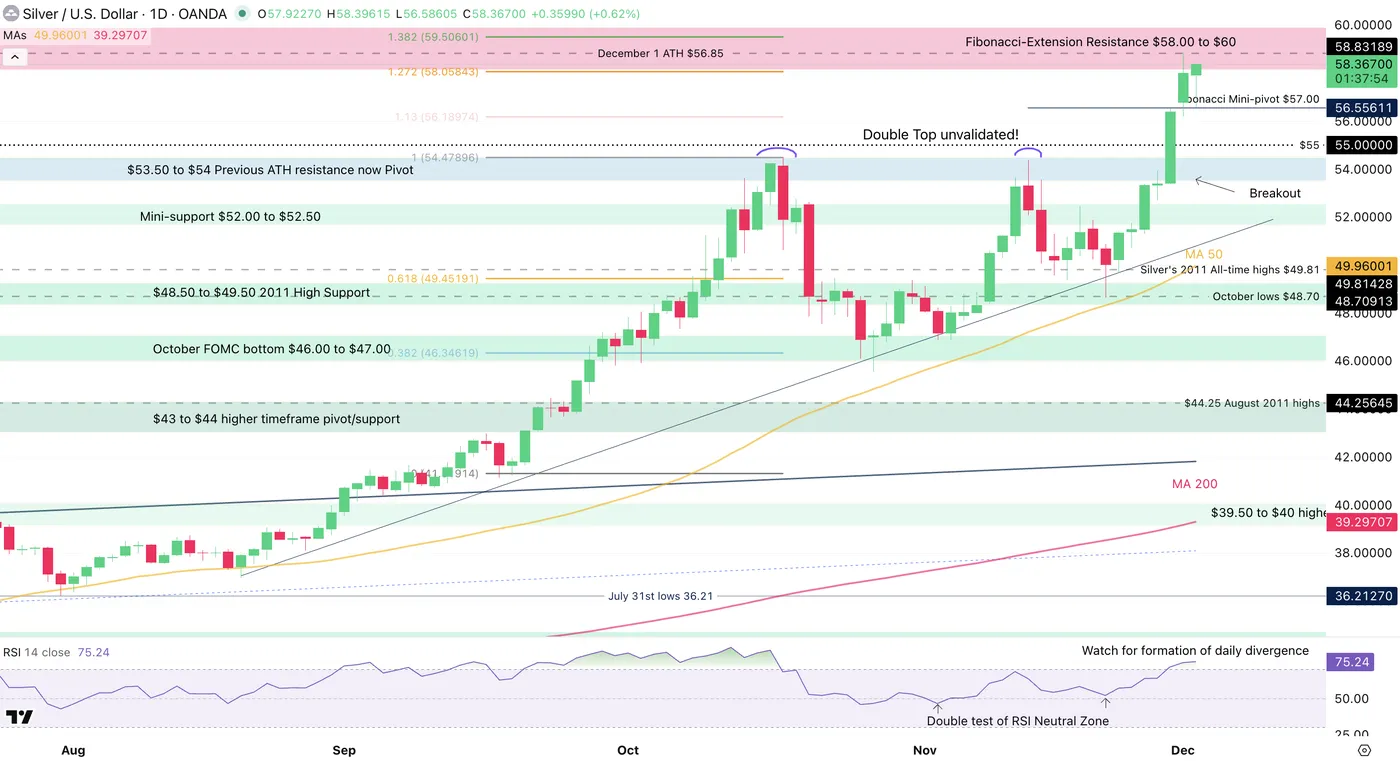
Silver Daily Chart, December 2, 2025 – Source: TradingView
The month-end action took Silver prices to a strong breakout after a month-and-half consolidation.
A double top did form throughout the two tests of the preceding $55.00 record, however, double top doesn’t mean instant bear market.
On the other hand, it may have acted as a contrarian-fuel for higher prices as bearish positions accumulated before the month-end rally changed the plans.
Back to current trading, bulls have brought the metal right back into its $58.00 to $60 Resistance Zone, precedingly obtained with Fibonacci Extensions (see explanation here).
With the zone extending over a $2 range, there is space for trading but what traders should look is whether prices break and close above $60 on a daily session or if prices actually close below $58, indicating some rejection.
4H Chart and Technical Levels
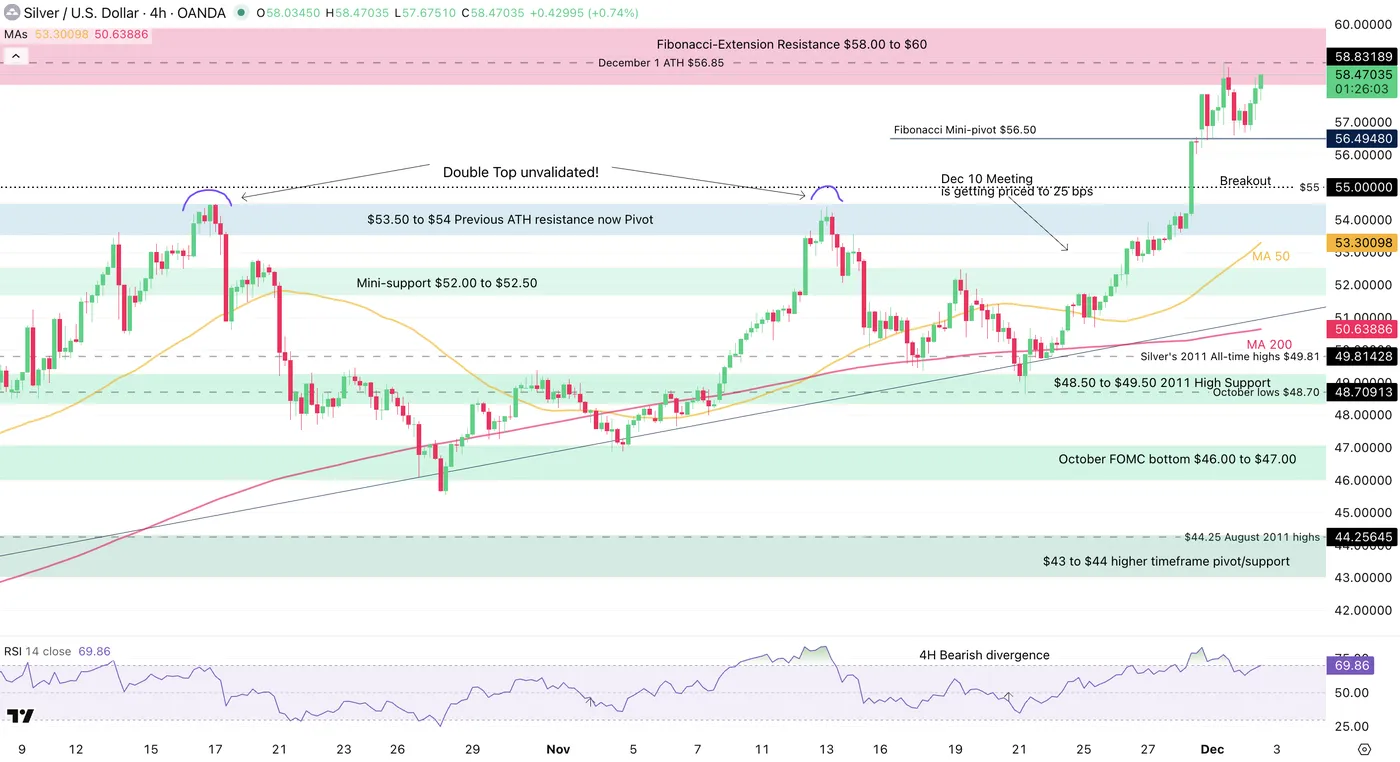
Silver 4H Chart, December 2, 2025 – Source: TradingView
The price action is getting tricky as buyer strength stands strong and prices are consolidating at the highs (typically bullish) but a 4H divergence is appearing.
Levels to watch for Silver (XAG) trading:
Resistance Levels:
- Fibonacci-Extension Resistance $58.00 to $60
- December 1 All-Time Highs $56.85
- $53.50 to $54 current ATH resistance
- Potential resistance $62 to $65 (1.618 from Impulsive Move)
Support Levels:
- $53.50 to $54 Previous ATH resistance now Pivot
- Mini-support $52.00 to $52.50
- $48.50 to $49.50 2011 High Support
- October FOMC bottom $46.00 to $47.00
- $45.55 October 28 lows
1H Chart
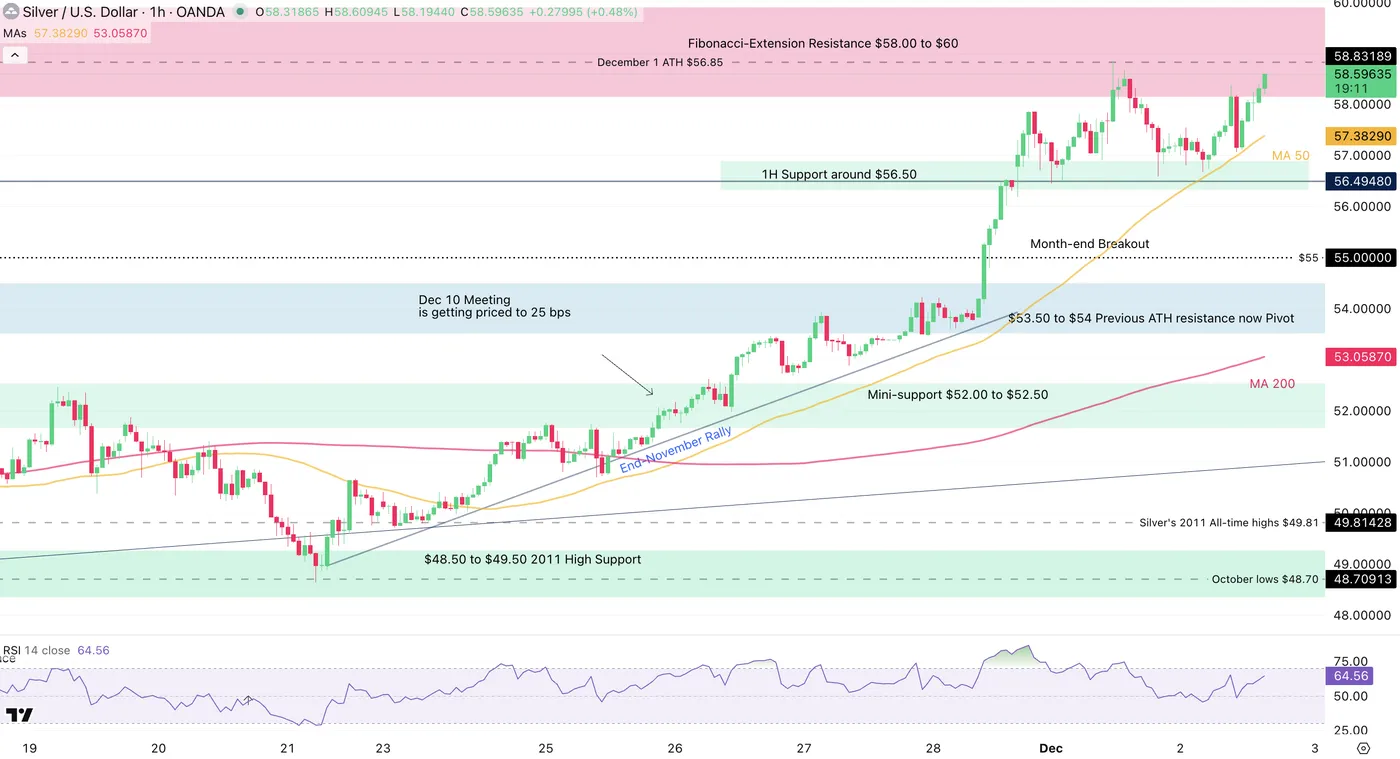
Silver 1H Chart, December 2, 2025 – Source: TradingView
The rangebound action is occuring much higher than last week – As higher momentum charts stand in overbought territory, short-term consolidation at the highs serve to reduce effect of overbought trading.
An ongoing move might take on the record highs reached yesterday – For intraday analysis look at the 1H 50-period Moving Average, frequently used by buyers in this uptrend.
Holding it provides entry points to join the rally, while breaking the Moving Averages gives signal of a short-term bearish reversal.
Safe Trades!