
, as:)
On 2 December, we noted that the final month of the year is traditionally favourable for the S&P 500 index (US SPX 500 mini on FXOpen), as:
→ since around the 1950s, December has been positive in more than 70% of cases;
→ the average monthly gain is approximately +1.0%.
Today, with traders worldwide focused on the Federal Reserve’s interest rate decision and Chair Powell’s subsequent press conference, there is reason to highlight another statistic. According to media reports, in 20 out of 20 instances when equity markets were near record highs and the Fed cut rates, the S&P 500 rose over the following 12 months.
Given the current backdrop — proximity to all-time highs and expectations of rate cuts — it is possible that this could become the 21st such case.
An analysis of price action on the 4-hour chart of the S&P 500 (US SPX 500 mini on FXOpen) suggests that the stock market is reflecting nervous anticipation of the news, as the index is trading at roughly the same levels as at the start of December.
Technical Analysis of the S&P 500 Chart
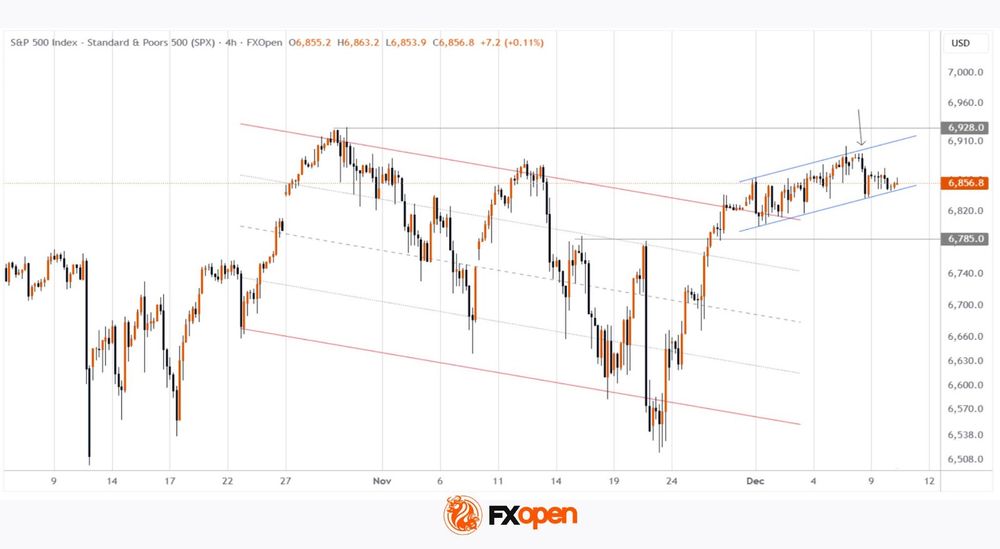
From the demand side:
→ the price has managed to hold firmly above the 6785 level (which may act as support going forward) and has broken above a previously formed descending channel (shown in red);
→ an ascending channel formed in early December, which can be interpreted as cautious optimism ahead of the news.
From the supply side:
→ the late-October record high may act as psychological resistance;
→ yesterday’s decline (indicated by the arrow) suggests that bears are ready to act more aggressively if given a catalyst.
Overall, taking the above into account, it is reasonable to suggest that the S&P 500 market (US SPX 500 mini on FXOpen) is in a “calm before the storm” phase. Be prepared for volatility spikes later today, starting from 22:00 GMT+3.
Trade global index CFDs with zero commission and tight spreads. Open your FXOpen account now or learn more about trading index CFDs with FXOpen.
This article represents the opinion of the Companies operating under the FXOpen brand only. It is not to be construed as an offer, solicitation, or recommendation with respect to products and services provided by the Companies operating under the FXOpen brand, nor is it to be considered financial advice.