
The US Dollar took a hit following yesterday’s Fed decision, driven by mechanical flows typical after a rate cut.
Given the rally to new cycle highs over the past two months, current outflows aren’t surprising—benefiting not just the majors, but especially exotic currencies.
Prior to the meeting, the Dollar had held relatively strong despite a dovish Fed repricing, ranging near its recent highs supported by elevated yields following Williams’ comments.
However, despite the Dot Plot projecting only ~2 cuts for 2026 and Chair Powell suggesting the US is entering the “high end of the neutral rate range,” the Dollar is sliding back to mid-October levels.
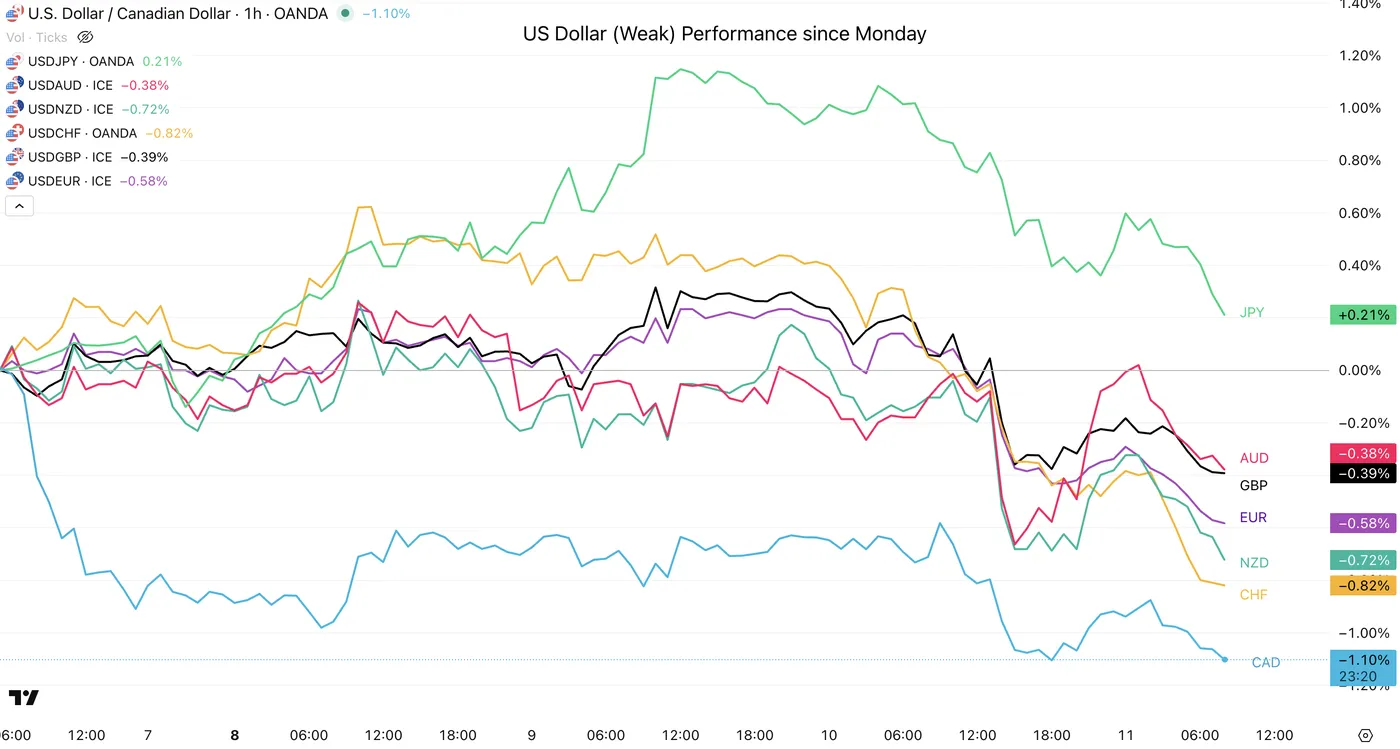
US Dollar Performance against Majors since the beginning of the Week – Source: TradingView
The cut itself was neither explicitly dovish nor hawkish; communications were solid.
If you missed Powell’s speech (great recap right here), he placed extra emphasis on inflation. Consequently, as noted yesterday, future inflation data may carry even more weight than the NFP (which is projected to ease gradually over the next year).
The Fed has been driving blind with limited inflation reports since September due to the government shutdown, making upcoming prints critical for markets.
November NFP is scheduled for December 16, followed by CPI on Dec 18.
Let’s dive into the Dollar Index (DXY) charts to spot how much deeper the Dollar can correct given this shift in fundamentals.
Dollar Index (DXY) Multi-timeframe Outlook
Daily Chart
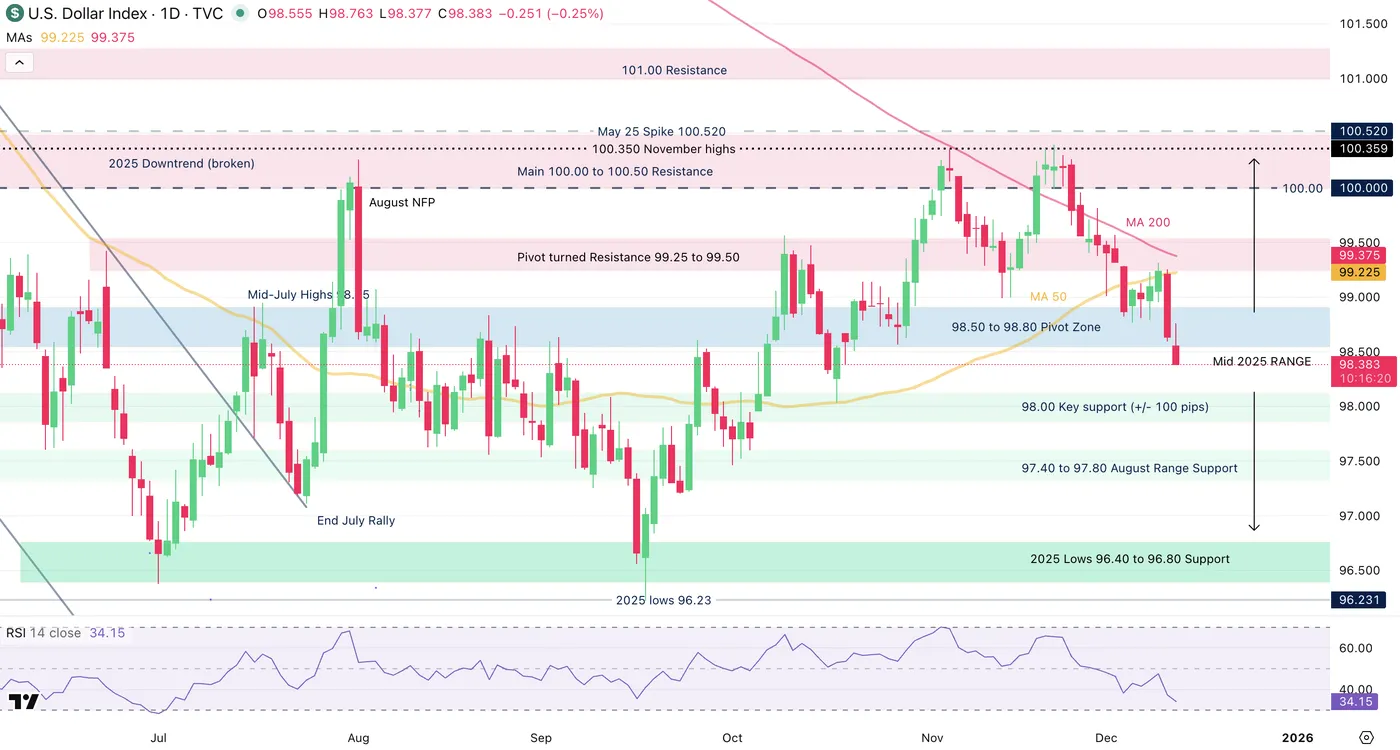
Dollar Index (DXY) Daily Chart, December 11, 2025 – Source: TradingView
The Dollar is falling harshly after trying to hold its elevated range, nothing too surprising here – Yesterday’s move was based from its 200-Day Moving Average acting as resistance and now breaking below its key Pivot Area rendering the DXY bearish short-term.
Looking back even further, the US Dollar is holding a long-term rangebound trajectory since mid-2025 between 97.00 to 100.00 – Makes sense when looking at its first-half harsh fall (-12% since January).
On the bigger picture, cuts have been expected for a long-time in the US so yesterday did not surprise Macro traders too much.
Still, with the Daily RSI going towards the bearish territory and momentum getting strong, the fall should continue at least towards the 98.00 Support area, allowing other majors to appreciate.
4H Chart and Technical Levels
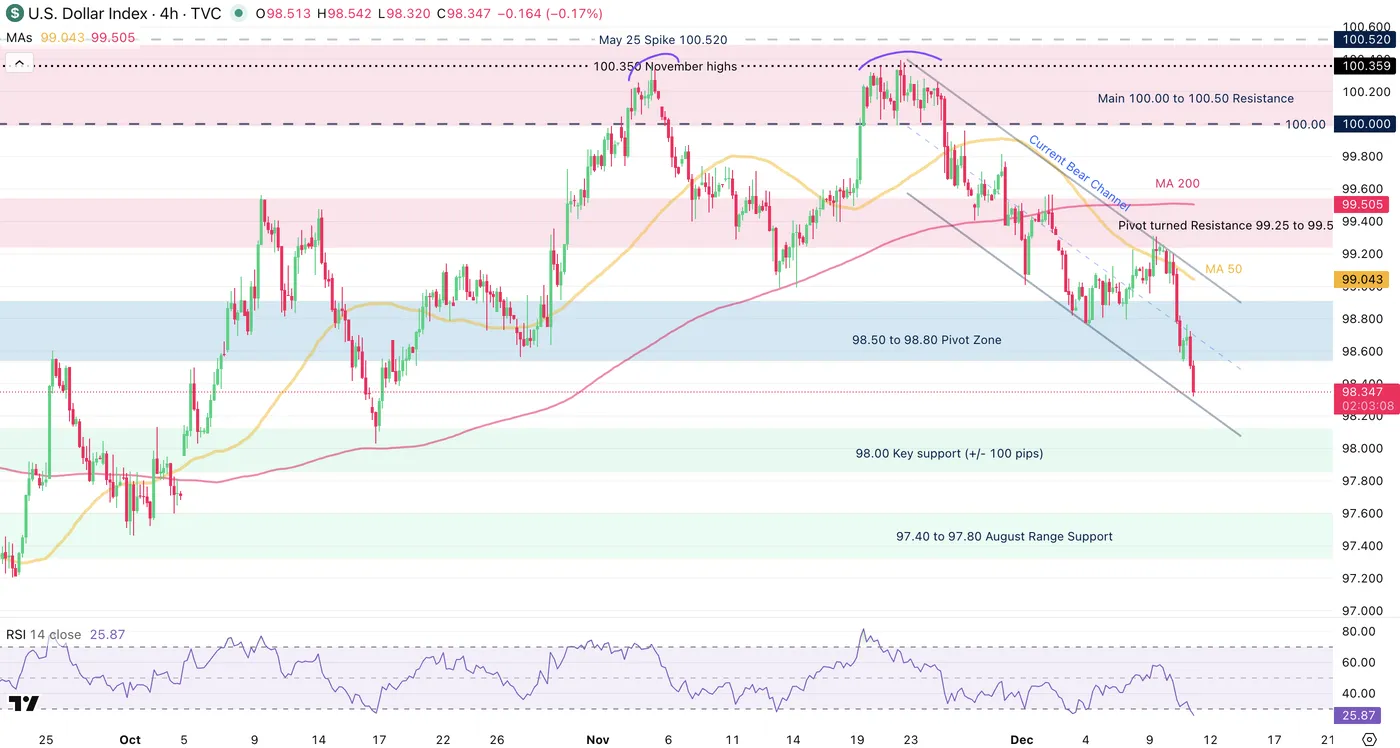
Dollar Index (DXY) 4H Chart, December 11, 2025 – Source: TradingView
Keep a close eye on the Dollar Bear Channel in Intraday timeframes which should guide short-term flows.
Levels to place on your DXY charts:
Resistance Levels
- 100.00 to 100.50 Main resistance zone
- 100.376 November highs
- 99.80 mini-resistance
- 98.50 to 98.80 Pivot Zone
Support Levels
- 98.25 Lower bound of 4H Channel
- 98.00 Key support (+/- 100 pips) Next support
- 97.40 to 97.80 August Range Support
- 2025 Lows 96.40 to 96.80 Support
1H Chart
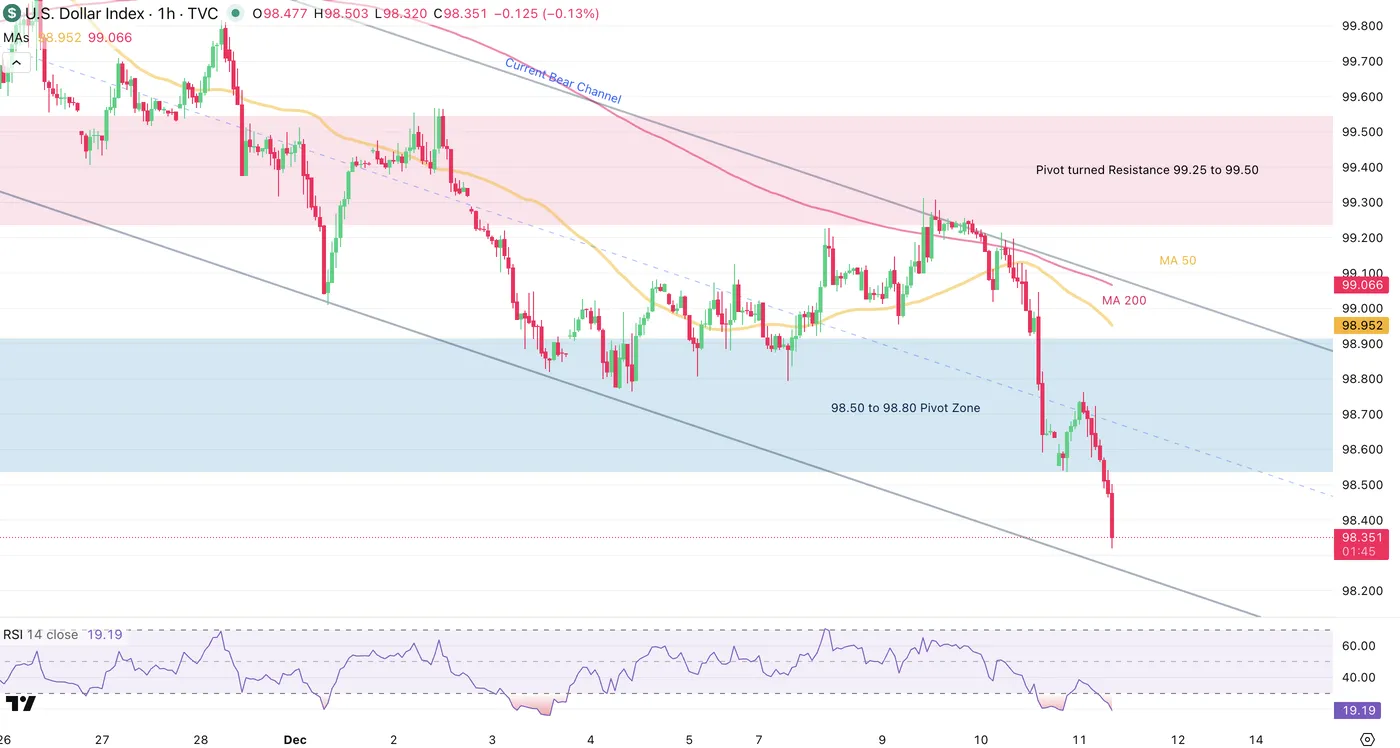
Dollar Index (DXY) 1H Chart, December 11, 2025 – Source: TradingView
Watch to the reactions as the Dollar reaches the lower bound of the Channel between 98.20 to 98.30 and spot how other assets correlate.
There has been profit-taking flows overnight in Equities so keep an eye on this and flows in other FX currencies throughout the session.
Safe Trades!