
Key Highlights
- WTI Crude Oil prices started a recovery wave above $56.50.
- A key bearish trend line is forming with resistance at $58.30 on the 4-hour chart.
- Gold started a fresh increase above $4,380 and $4,400.
- EUR/USD extended losses and declined below the 1.1700 level.
WTI Crude Oil Price Technical Analysis
WTI Crude Oil price started a decent increase above $56.50 against the US Dollar. The price settled above $57.00 to enter a positive zone.
Looking at the 4-hour chart of XTI/USD, the price tested the $59.00 zone before there was a downside correction. The price retested the $56.50 support and recently recovered some losses. It reclaimed the 100 simple moving average (red, 4-hour) but remained below the 200 simple moving average (green, 4-hour).
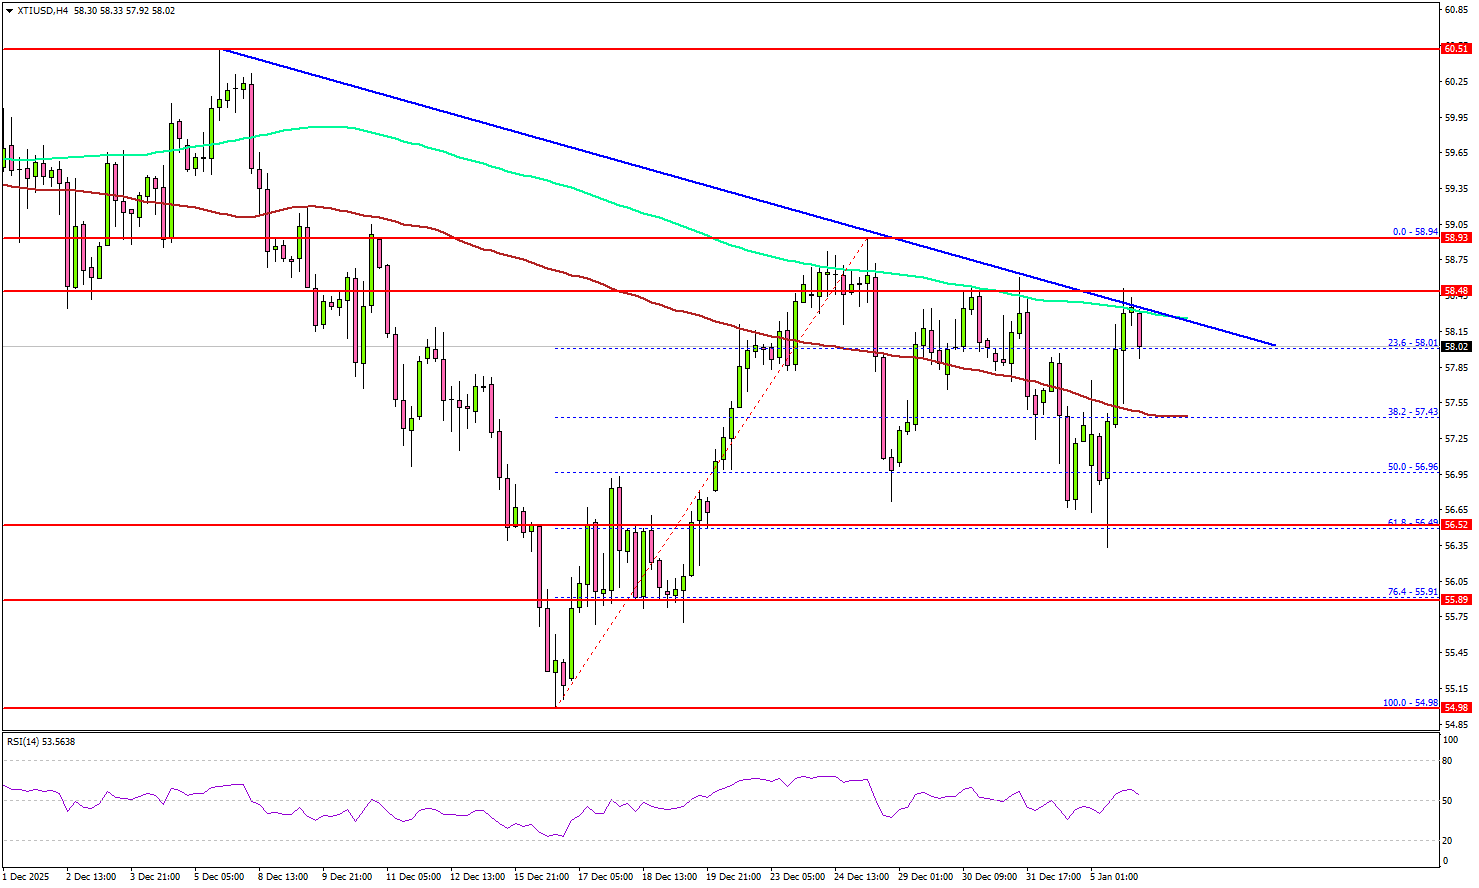
On the upside, immediate resistance is near the $58.50 level. There is also a key bearish trend line forming with resistance at $58.30 and the 200 simple moving average (green, 4-hour).
The first key hurdle for the bulls could be $59.00. A close above $59.00 might send Oil prices toward $60.00. Any more gains might call for a test of $62.00 in the near term.
On the downside, the first major support sits near the $56.50 zone. The next support could be $55.50. A daily close below $55.50 could open the doors for a larger decline. In the stated case, the bears might aim for a drop toward $54.00.
Looking at Gold, the bulls remained in action, and the price started a fresh increase above the $4,400 resistance.
Economic Releases to Watch Today
- Fed’s Barkin speech.
- US S&P Global Composite PMI for Dec 2025 – Forecast 52.9, versus 53.0 previous.