
Key Highlights
- Bitcoin climbed toward $95,000 before correcting some gains.
- BTC/USD is well above a bullish trend line with support at $89,000 on the 4-hour chart.
- Ethereum started a decent increase above $3,000 and $3,120.
- XRP price rallied toward $2.50 before it faced heavy resistance.
Bitcoin Price Technical Analysis
Bitcoin price found support near $86,800 and started a fresh increase against the US Dollar. BTC climbed above $89,500 and $90,000 to enter a short-term positive zone.
Looking at the 4-hour chart, the price even surpassed $92,000 before it faced sellers near $94,800. A high was formed at $94,794, and the price settled above the 100 simple moving average (red, 4-hour) and the 200 simple moving average (green, 4-hour).
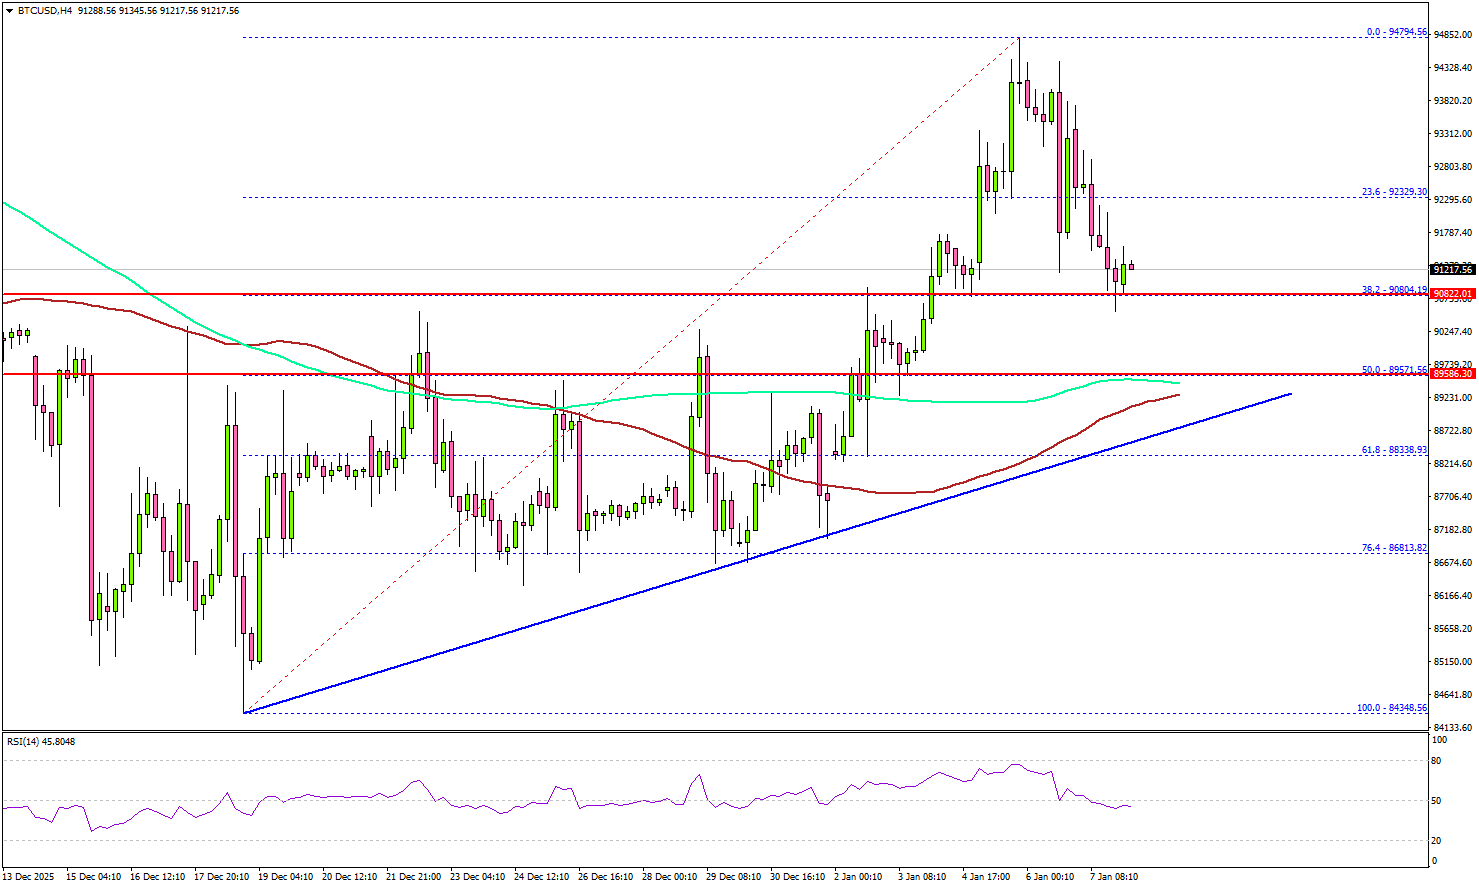
Recently, there was a downside correction below the 23.6% Fib retracement level of the upward move from the $84,384 swing low to the $94,794 high.
However, BTC is well above a bullish trend line with support at $89,000. Immediate support sits at $90,800. A downside break below $90,800 might start another decline. The next major support is $89,200, the 100 simple moving average (red, 4-hour), and the trend line at $89,000.
If there is another increase, the price could face resistance at $93,500. The first key hurdle is $94,200. The main hurdle could be $95,000. A successful close above $95,000 might start another steady increase. In the stated case, the price may perhaps rise toward the $96,500 level. Any more gains might call for a test of $98,000.
Looking at Ethereum, the price moved into a short-term positive zone and might soon aim for a move above $3,300.
Today’s Key Economic Releases
- US Initial Jobless Claims – Forecast 210K, versus 199K previous.
- US Goods and Services Trade Balance for Oct 2025 – Forecast $-58.9B, versus $-52.8B previous.