
.)
WTI Crude Oil, currently trading near $59.15 as of January 15, 2026, is under pressure following a sharp reversal and failure to hold the $61.00 level, driven by geopolitical volatility and the evaporation of a risk premium. This technical analysis explores the immediate neutral-to-bearish short-term outlook, while noting significant long-term indicators, such as the oversold monthly Stochastic and a 15-year short extreme in the COT report, which suggest the potential for a substantial bullish trend reversal.
Crude oil – Daily chart
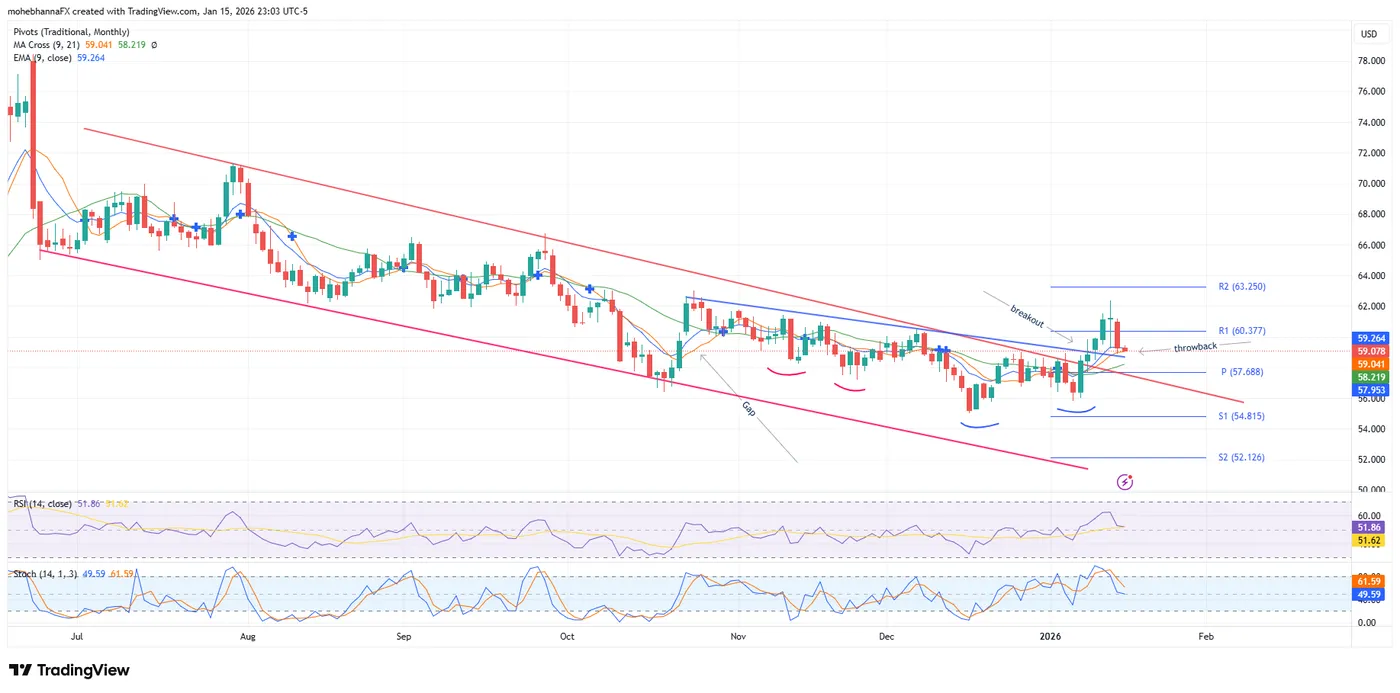
Source: Tradingview.com Crude oil daily chart – Past performance is not indicative of future results
- Market Context & Price Action: WTI Crude oil is currently trading around $59.15, having recently undergone a sharp reversal after failing to sustain a breakout above the $61.00 level. The chart reflects a period of heightened volatility triggered by geopolitical developments (specifically regarding US-Iran tensions) that saw a rapid “risk premium” evaporation.
- As of June 2025, crude oil has been trading within a descending Channel, as marked by the red lines on the above chart. On Friday, January 9th, 2026, price action broke above the descending channel’s upper boundary and has remained above it since. The break took the price above a confluence of resistance, the intersection of the SMA21, the upper channel boundary, and the monthly PP at 57.68. The broken level has now turned into support.
- Candlestick Analysis: The most recent daily candle is a large red “marubozu-style” or bearish engulfing candle, indicating intense selling pressure and a rejection of the recent multi-day rally.
- Monthly Support/Resistance levels: Pivot Point (P) at $57.68. Above that, resistance is firm at $60.37 (R1) and $63.25 (R2). Immediate support lies at $54.81 (S1).
- Price action broke above a secondary, steeper descending line (blue) and completed a throwback, finding support above the broken level. The fast EMA9 and SMA9 intersect with the blue line, forming an intermediate confluence of support.
- Gap Analysis: A significant price gap from early November (marked on the chart). Gaps often act as “magnets” for price action, even after they have been filled.
- Momentum oscillators: RSI (14): Currently at 52.21. This is a neutral reading, showing that the recent overbought conditions have been reset. However, the sharp downward slope of the RSI line indicates potential decelerating momentum.
- Stochastic (14, 1, 3): The Stochastic Oscillator is at 50.67 and falling. It has fallen below its signal line from a high, confirming short-term weakness.
Crude oil – Monthly chart
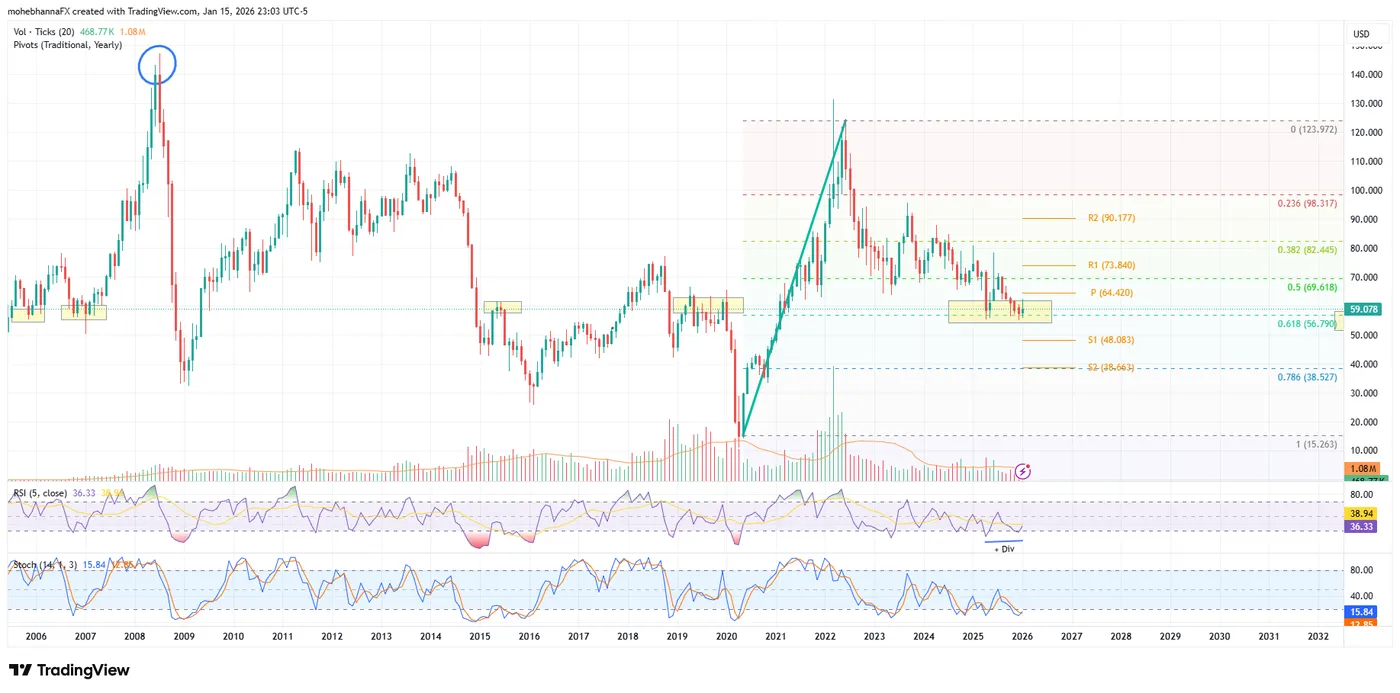
Source: Tradingview.com Crude oil monthly chart – Past performance is not indicative of future results
- Applying the Fibonacci retracement (FIB) level to the “V-shaped” recovery from the 2020 lows (green diagonal line), which peaked in 2022 near $123.00, reflects that the current price of $59.22 is situated within a critical technical “battleground” defined by yearly levels.
- This area (highlighted in the yellow box) is a primary long-term support zone where the price has historically encountered support/resistance. The current price action on the monthly chart suggests a potential double bottom is forming.
- Momentum Oscillators: A potential positive divergence may be in play, as RSI is making higher lows while price action is making equal lows. (The potential double bottom)
Stochastic (14, 1, 3): Sitting at 16.40, the Stochastic is in the oversold territory. Historically, readings this low have often preceded a short-term relief rally or a period of stabilization.
Commitment of traders report (COT)
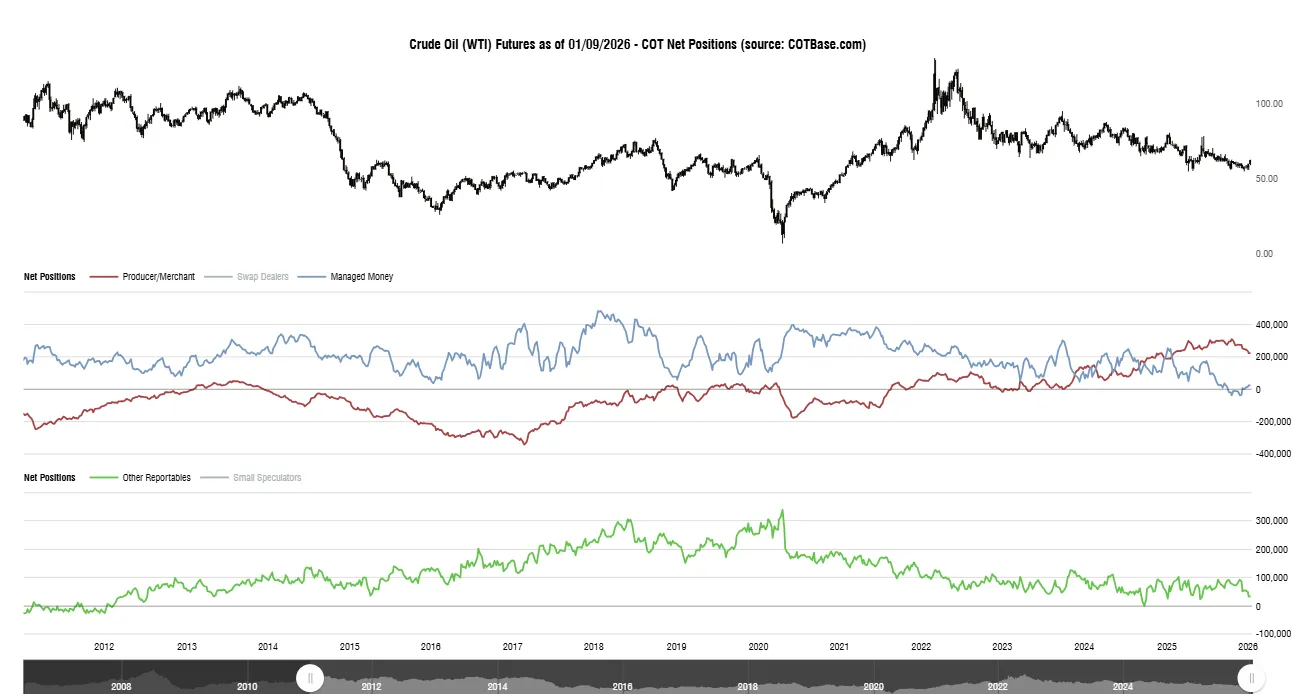
Source: Cotbase.com Commitment of traders – Crude oil COT report
The most recent COT report, released on January 9th, 2026, including data up to January 6th, 2026, reflected that the “Managed money” category has reached a 15-year net short position level extreme, and is currently moving towards net long territory, suggesting that a change in sentiment and a reversal may be in play. Producers/Merchants’ positioning is also moving towards short after reaching an all-time high, an extreme long position level.
Conclusion
The technical verdict for WTI Crude Oil is immediately neutral-to-bearish, with the failure to hold above $60.00 and the break below moving averages suggesting the path of least resistance is toward the S1 support level ($54.81). Bulls must secure a daily close back above the Pivot ($57.69) to regain control. This short-term caution, however, is offset by significant long-term indicators: the price is in a critical monthly Fibonacci support zone, the Stochastic oscillator is oversold, and the recent COT report shows a 15-year Managed Money short extreme. Ultimately, while traders should respect the short-term downside risk, the underlying sentiment and monthly chart structure suggest that the current price action may be forming the foundation for a more substantial, long-term bullish trend reversal.