
Despite what the banks and global analysts say in their 2026 projections, the Dollar has strengthened since the start of the year and shows only few signs of weakening.
Of course, we are just halfway through January; there is still plenty of time for things to change. However, the Dollar’s trajectory is now looking quite different.
The Dollar Index isn’t at 110.00 like it was just a year ago, before the Greenback corrected by 10% against all of its major peers – now hanging right around the 100.00 level.
Consolidating since mid-July, bears have mostly barked, but the harsh descent seems already over.
The reason for that? US economic performance is still beating its competitors despite tariffs, and US firms, particularly in the Tech and AI sectors, are dominant.
Despite fears and headlines, American employment is still in a decent spot and has stalled its expected decline, as reflected in recent Jobless Claims and Non-Farm payroll numbers.
To add injury to insult, the US Federal Funds Rate is the highest among the majors (except for the Bank of England’s Rate, with which it is tied), leaving basis trades well active.
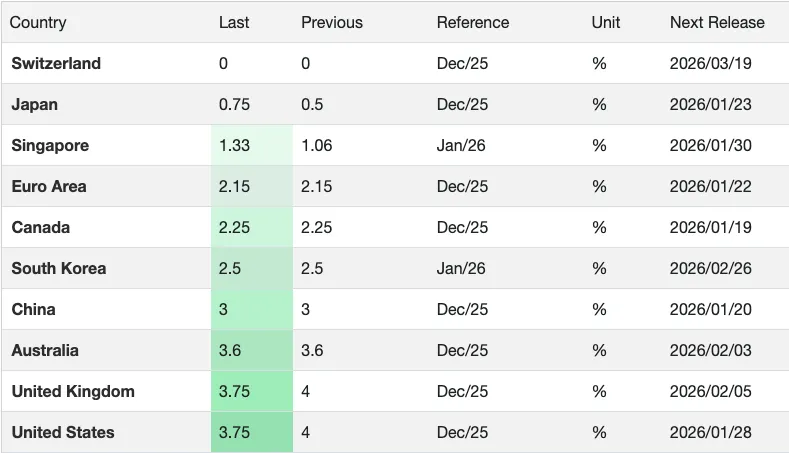
Interest Rates from OECD Countries – Courtesy of TradingEconomics
It wasn’t just the Greenback that was targeted last year – currency debasement hit all majors, as seen in Gold’s performance against the OECD FX Basket.
So is the Dollar still in danger? Yes.
Policy directives from the Trump Administration can be unpredictable for nations and investors – Look at Canada PM Mark Carney turning to China for a Trade Deal in the absence of such from the US.
And of course, the Fed’s Independence at stake keeps hurting the Buck’s prospects, notably fueling rallies in metals since August, but hasn’t shown much change since, even with the latest Powell Investigation from the DOJ.
But as long as commodities are still priced in US Dollars, Banks and firms still require Dollar funding, and the US Treasury is still the most liquid, safe-haven asset available, the Dollar can’t just disappear from the system – leading to the current market conditions.
Finally, with the recent interventions in Venezuela, threats to Iran, the dollar saw demand from Freedom Trade flows.
On the other hand, some technical signals could point to a short-term correction in the USD demand.
We will look at the Dollar Index and EUR/USD to assess the current state of the Market and whether more upside is warranted for the Dollar after its strong, surprising start to 2026.
Dollar Index Daily Chart
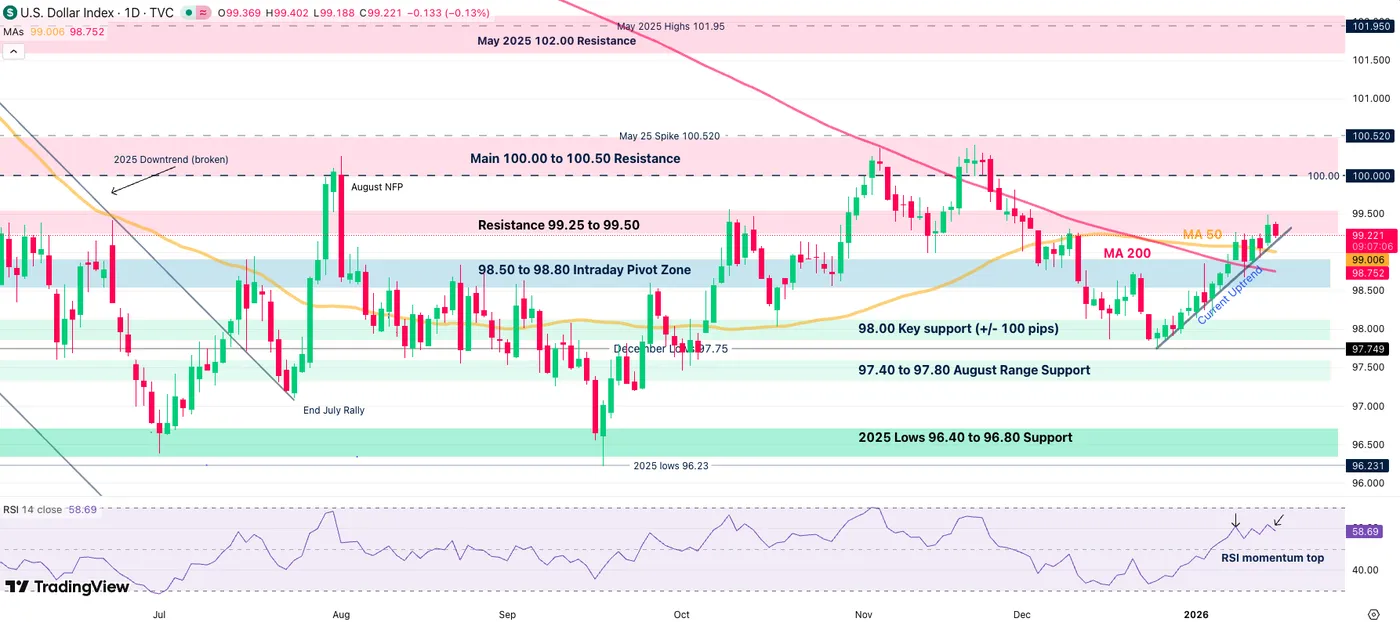
Dollar Index Daily Chart, January 16, 2026 – Source: TradingView
The US Dollar is rallying quite strongly since breaking out of its descending sequence from November.
Rebounding in a very consistent uptrend, the DXY has held support and shown no corrections since December 24.
However, now reaching the highs of its 99.50 Resistance Zone, momentum is weakening as can be seen on the Daily RSI.
Let’s see what will tilt the scales on the 4H Chart.
4H Chart and Levels of Interest
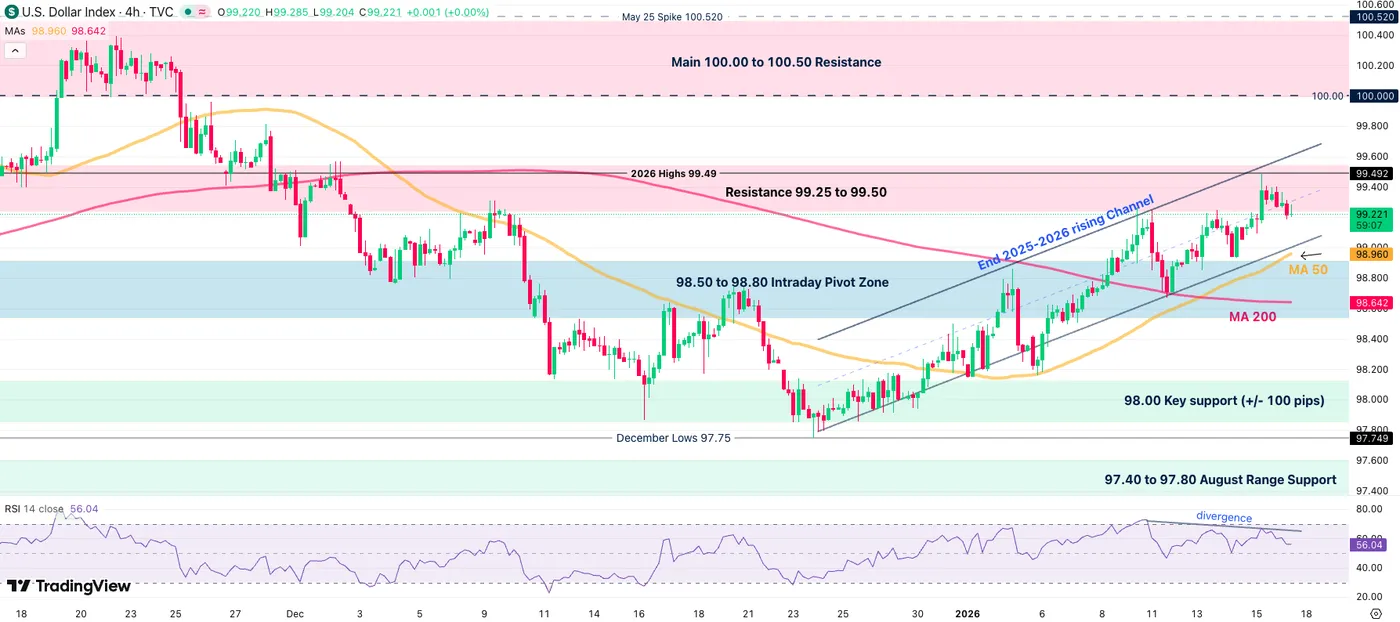
Dollar Index 4H Chart, January 16, 2026 – Source: TradingView
Showing a bear divergence in the 4H timeframe RSI, combined with the reaction to the resistance level, it looks like the Dollar is losing some steam.
Still, keep a close eye on the confluence of the 4H 50-MA at 98.96 and the 2026 Channel lows.
- Breaking that level would point to continued downside and could retest the December 2025 Lows at 97.75.
- In the event of any intervention in Iran, the Dollar can also spike above to keep that in mind.
Overall, the Moving Averages are flatlining in the US Dollar, indicating further consolidation/rangebound action for the time being.
Levels of interest for the Dollar Index:
Resistance Levels
- Immediate Resistance 99.25 to 99.50
- 2026 Highs 99.49
- 100.00 to 100.50 Main Resistance Zone
- 100.376 November highs
Support Levels
- 98.96 4H 50-MA and Channel Lows
- 98.50 to 98.80 Intraday Pivot Zone
- 98.00 Key support (+/- 100 pips)
- December Lows 97.75
- 97.40 to 97.80 August Range Support
- 2025 Lows 96.40 to 96.80 Support
EUR/USD 4H chart and Technical Levels
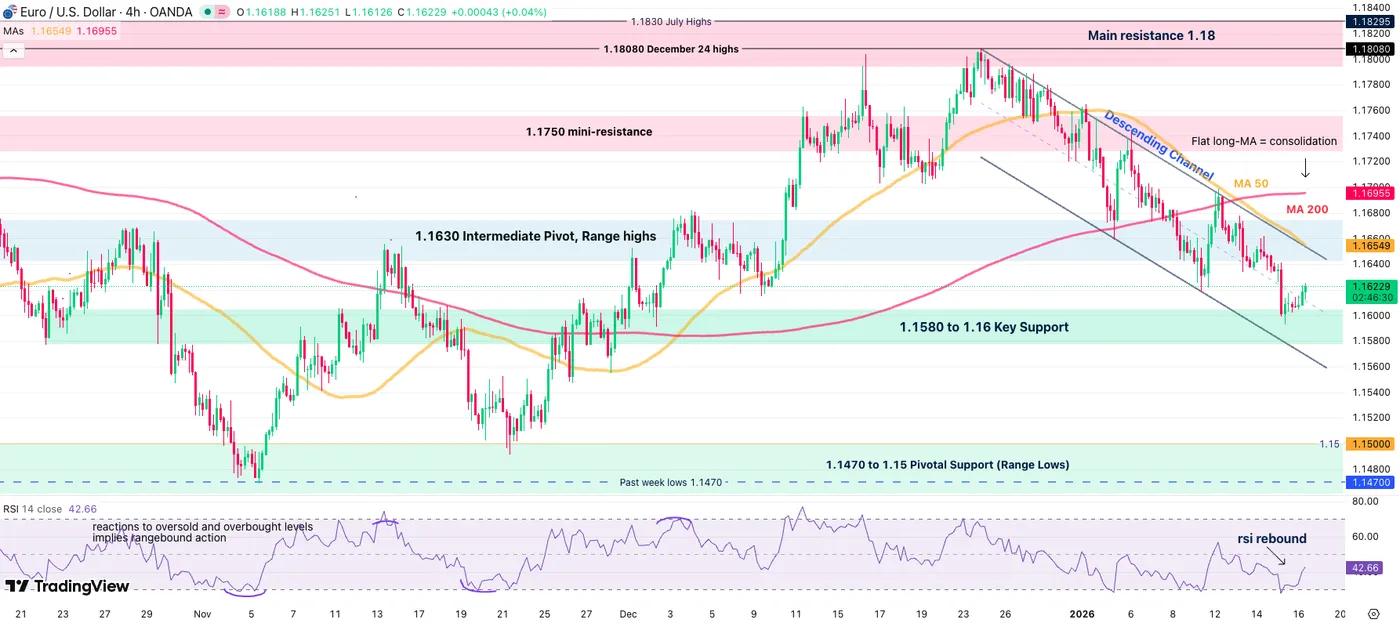
EUR/USD 4H Chart, January 16, 2026 – Source: TradingView
EUR/USD is showing reactions corroborating with the slowing momentum in the DXY.
Bouncing from the 1.16 Support and Channel lows, mean-reversion should hold well towards the 4H 50-MA at 1.1655.
Rallying on high volume and candles could easily lead to a break out of the descending channel towards the flatlining 200-Period Moving Average (at 1.17).
Levels to place on your EUR/USD charts:
Resistance Levels
- 1.1630 to 1.1670 Pivot zone (Channel Highs and 4H 50-MA)
- 1.17 4H 200-MA
- 1.1750 mini-resistance
- Resistance Zone around 1.18 (+/- 150 pips)
Support Levels
- 1.1580 to 1.16 Key Support
- 1.1560 Channel lows
- 1.1470 to 1.15 Pivotal Support
- 1.1350 to 1.14 Support
- Session lows 1.1593
Safe Trades and keep a close eye on Weekend Risk and Headlines!