
- Oil jumps 5% as traders predict attacks on Iran are getting closer by the second
- Exploring Technical Analysis for a rally in the commodity
- WTI could still be rising further – checking potential levels for breakouts
Oil is a complex commodity to trade – affected by numerous countries, suppliers, refineries, economic activity, and, these days, conflicts.
Iran has been a boiling pot for tensions since 1979, with the Islamic Regime extending extremist policies in the Middle East, supplementing small regional tensions to sponsoring full-capacity armies like in Lebanon with Hezbollah, Gaza with Hamas, or even further in Yemen with the Houthis.
The issue is when such policies come at the cost of Iran’s own civilian population, victim of extreme inflation, pollution, and resource scarcity (water levels are at 60-year lows) – The Iranian Rial has lost 97% of its value against the US Dollar in about a year.
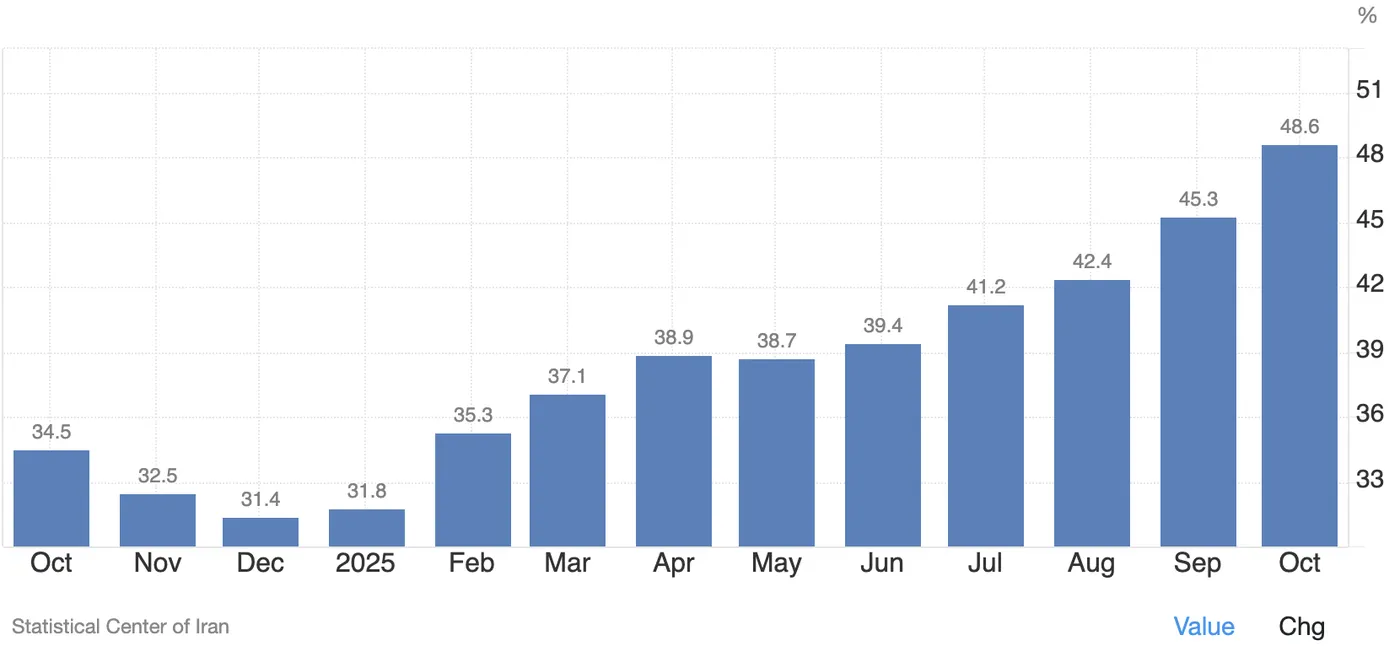
Iranian Inflation rate (until October 2025) – Source: TradingEconomics
With such conditions, without counting the public punishments and executions for regime dissenters, the population had seen many violent protests throughout the past many years.
But today looks even worse. An estimated 30,000 deaths are reported amid the recent revolts, and the toll could be even worse.
These reports and global US policies have pushed the Trump Administration to consider an imminent intervention to assist the Iranian population and eventually overthrow the Iranian government.
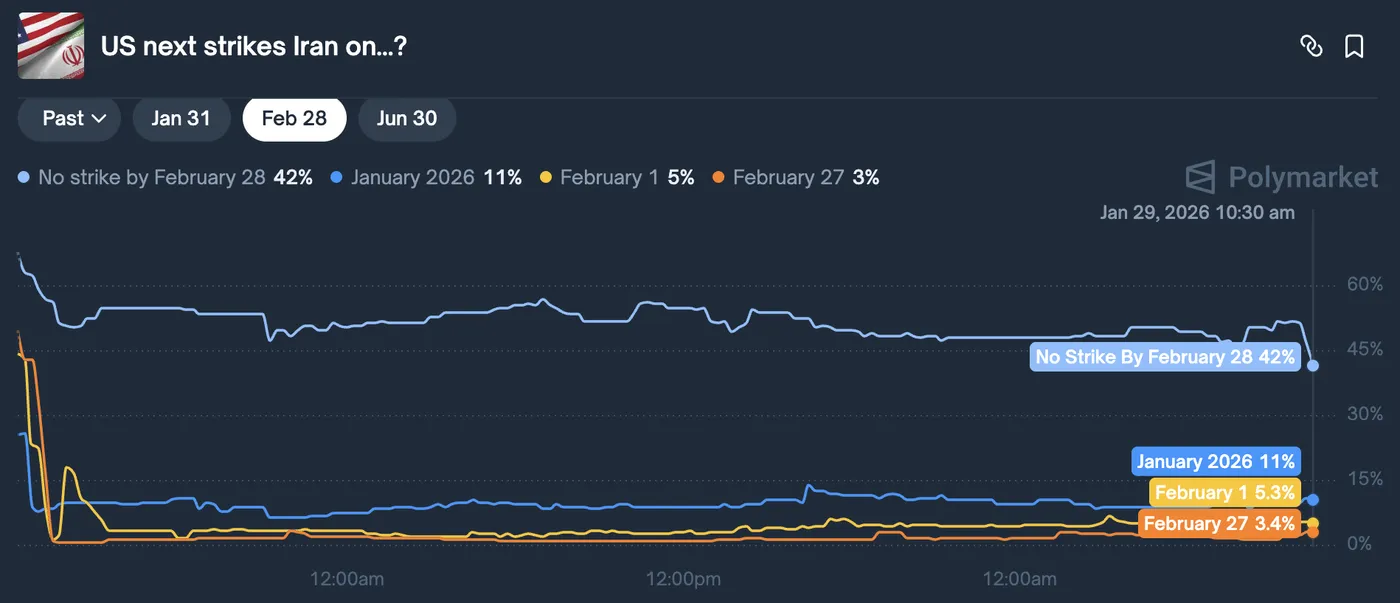
Odds for a US strike in Iran – Source: Polymarket
What concerns Markets is that Iran is a top-6 global oil producer and holds the second-largest natural gas reserves. If it were only that, Markets could be looking away after adding a small risk premium.
The larger threat, however, is the potential closure of the Strait of Hormuz, through which all energy-commodity shipping to Asia passes, accounting for around 20% of global Oil and gas flows.
During the 1980s, the Tanker War disrupted the Strait heavily, and attacks on tankers there could have a significant impact on Global Energy prices.
The current flows and tensions are also assisting Metals on their way to continued all-time highs. More on this coming up during today’s session.
As traders price in more imminent interventions from the US, which could signal a larger regional war, let’s dive into a multi-timeframe analysis of WTI (US) Oil to determine whether technicals point to continued upside or if prices are approaching relative extremes.
US Oil Multi-Timeframe Analysis
WTI Daily Chart
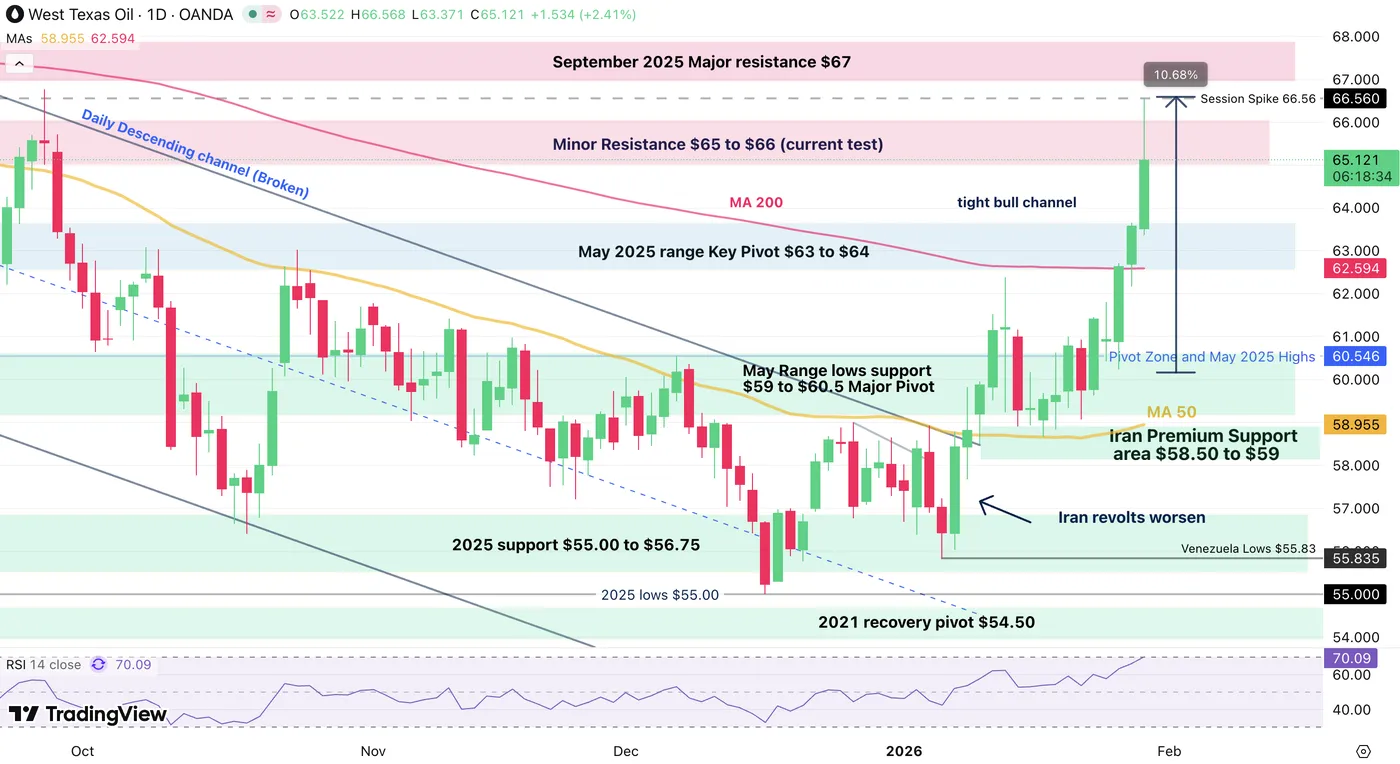
WTI Oil Daily Chart – January 29, 2026. Source: TradingView
As was expressed in our previous Oil piece, the 200-Day Moving Average ($62.59) offered a significant breakout signal after getting breached yesterday.
With the price action remaining solidly above its $58.50 Iran-Premium support, bulls have pushed for a daily tight bull channel in a 13% weekly rise.
Still, recent spikes to $66.56 highs have found rejection from increasingly overbought levels – As long as no attacks materialize, further upside could be limited. Let’s discover why on shorter timeframes.
WTI 4H Chart and Technical Levels
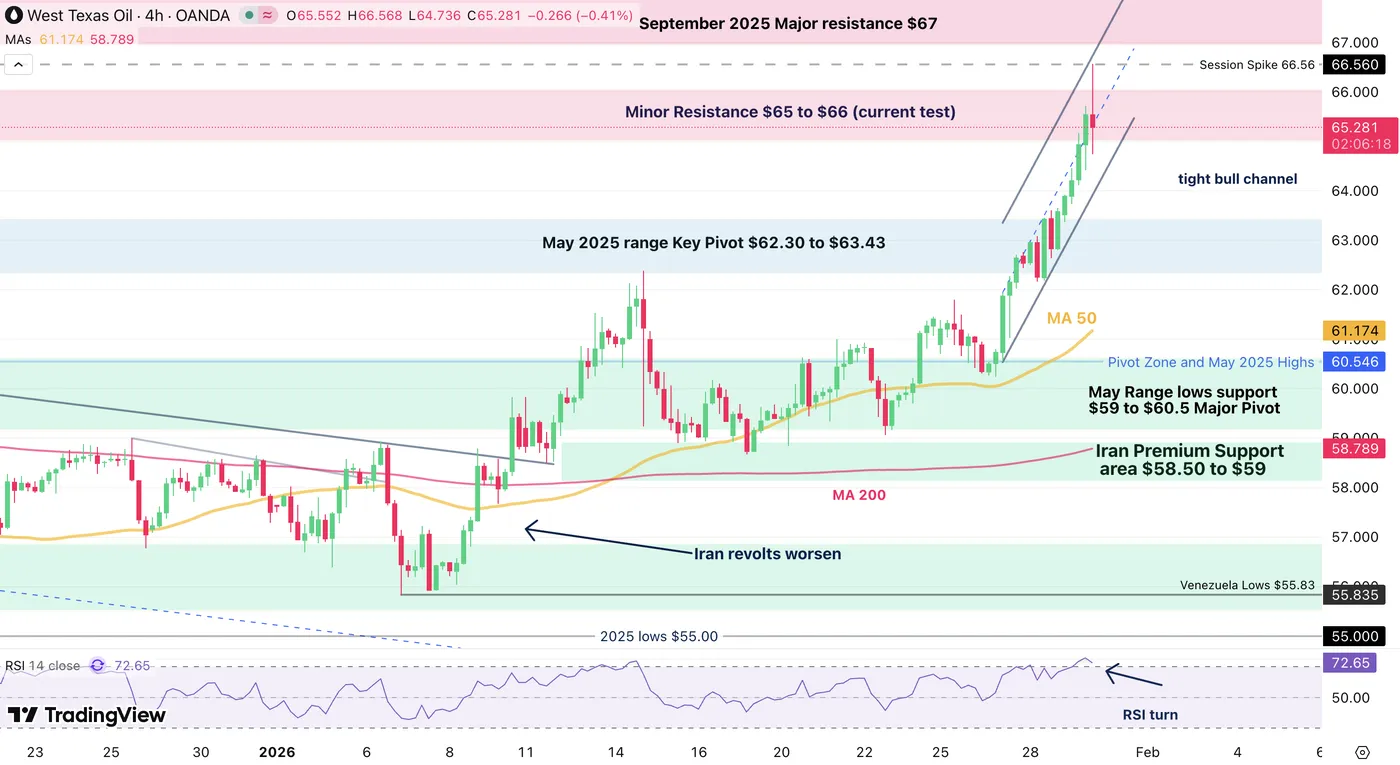
WTI Oil 4H Chart – January 29, 2026. Source: TradingView
With the recent spike in the action, RSI levels have turned into overbought conditions – logical when looking at the recent amassement of Military assets in the region.
The issue is that such volatility-premium spikes can be tricky to trade – A quick shift from Market maker pricing, demand explosions and headlines can trigger swift moves.
However, if nothing happens, the premium can quickly draw lower.
To spot if any attacks actually materialize, look at today’s peak.
- Any rise above $66.56 points at an actual attack and could see WTI extend to $78, similar level as during the 12-Day War.
- In the meantime, if nothing happens, a retest of the $62.30 to $63.40 Pivot zone could largely occur and would provide a decent pullback entry to avoid entering at extremes. Stop entries on breakouts could also be warranted.
WTI Technical Levels
Levels to place on your WTI charts:
Resistance Levels
- Session Spike $66.56
- Minor Resistance $65 to $66 (current test)
- September 2025 Major resistance $67 (could get breached if US attacks)
- Psychological Resistance $70
- $78.43 12-Day War highs
Support Levels
- $64.00 Tight Channel Lows
- May 2025 range Key Pivot $62.30 to $63.43
- May Range lows support $59 to $60.5 Major support
- Iran Premium Support area $58.50 to $59
1H Chart and Trading Setups
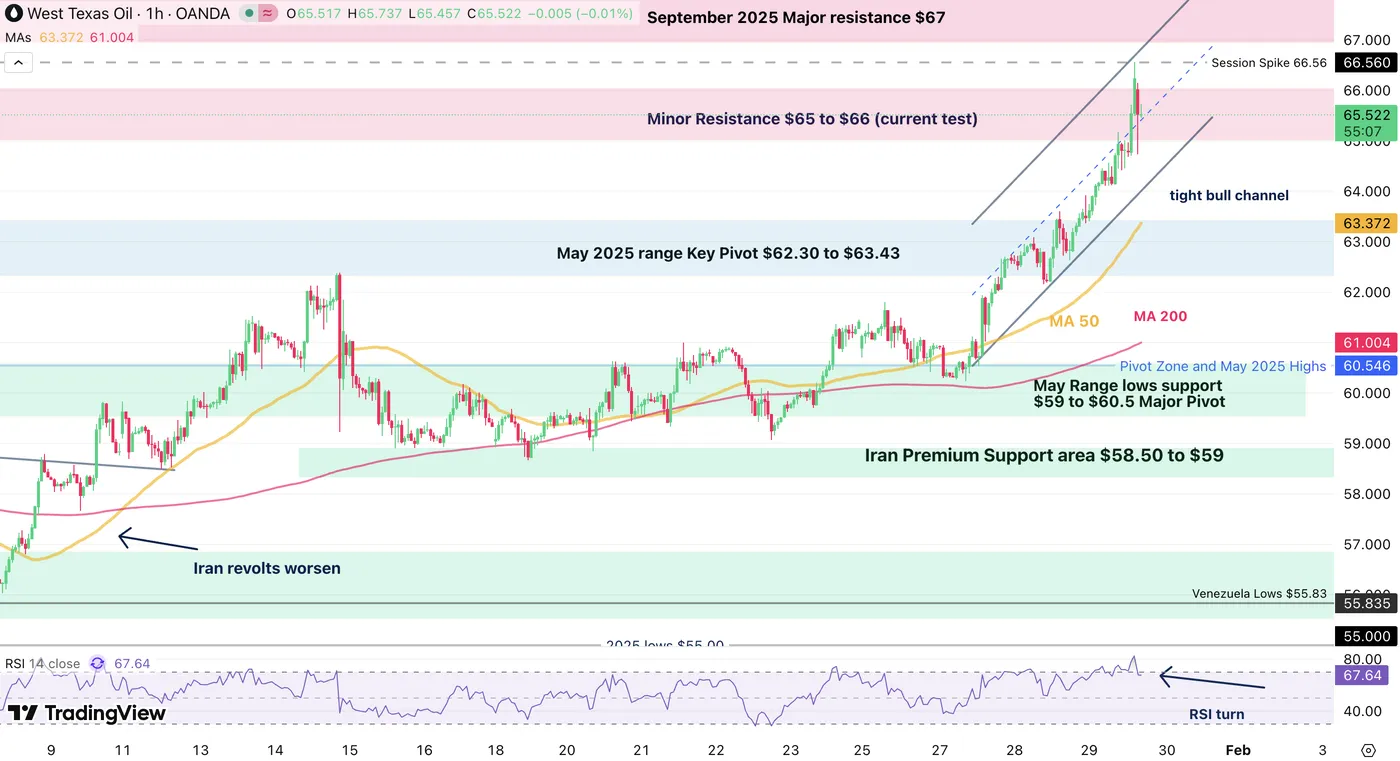
WTI Oil 1H Chart – January 29, 2026. Source: TradingView
Looking even closer, the $65-$66 Resistance level will act as key area of interest:
- Remaining within the range through today and this weekly close would point to a continued breakout (lower odds if nothing new happens)
- Rejecting it however points to a retracement at least to the Main Pivot Zone
- Any sudden breakout above implies an actual attack – The premium is now fully priced in, hence any further reactions would confirm that the risk is on.
Safe Trades and Stay in Touch with the Latest News!