
.)
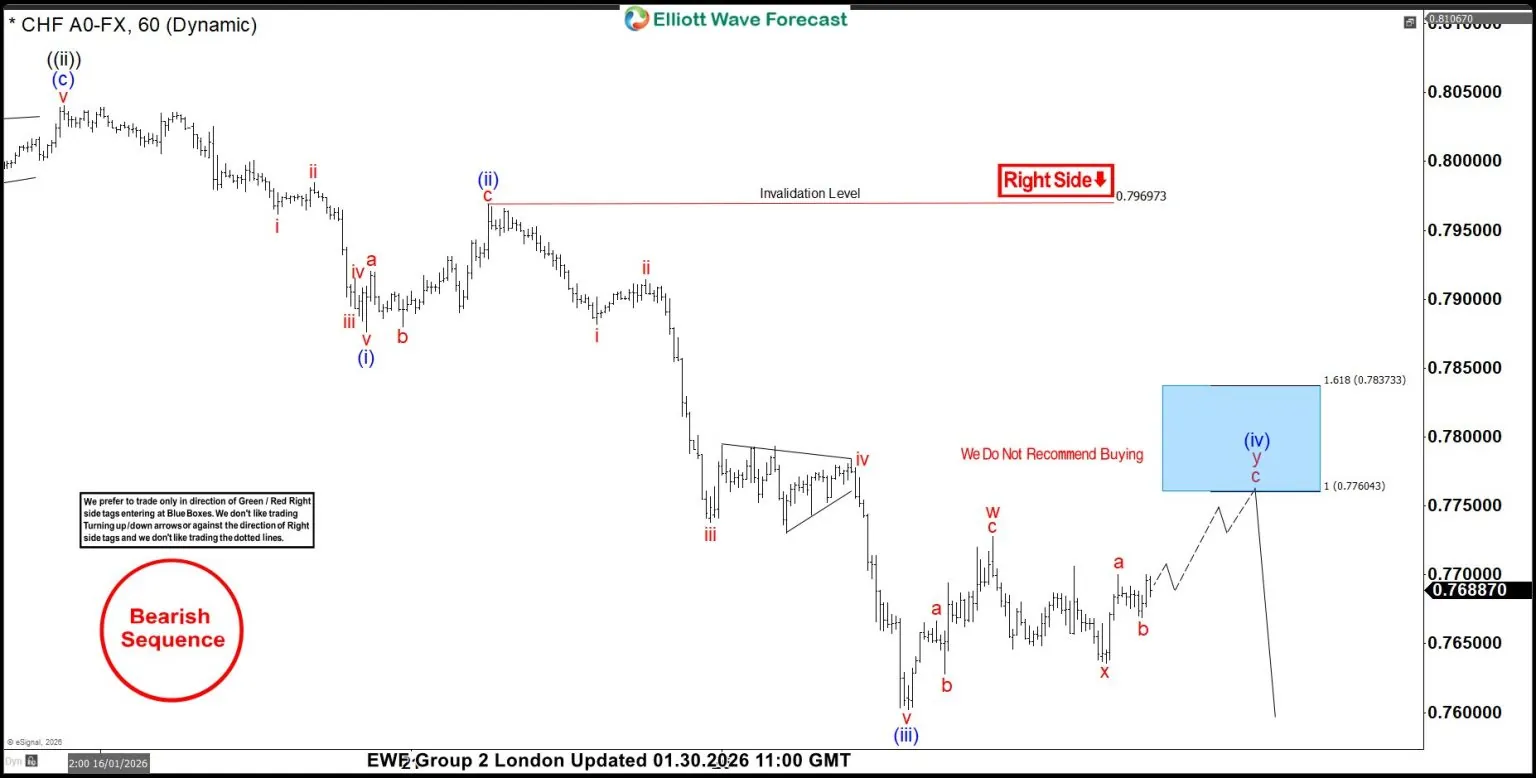
On January 30 2026 our clients was expecting for USDCHF to push higher to terminate red wave c, red wave y, blue wave (iv).
The first chart below was published in our private members area and clearly shows the Elliott Wave count was calling for the red wave c push higher.
The second chart is my buy entry. When the USDCHF pair tagged the bullish FVG zone (Gray Box) I entered the buy trade at 0.7667 with a 29 pip stop loss at 0.7638 and a take profit target at the 2R 0.7725.
Added confirmation for the buy entry was the bullish divergence market pattern (Pink) which formed at the red wave x termination.
USDCHF 1 Hour Chart January 30 2026
USDCHF 1 Hour Chart January 30 2026
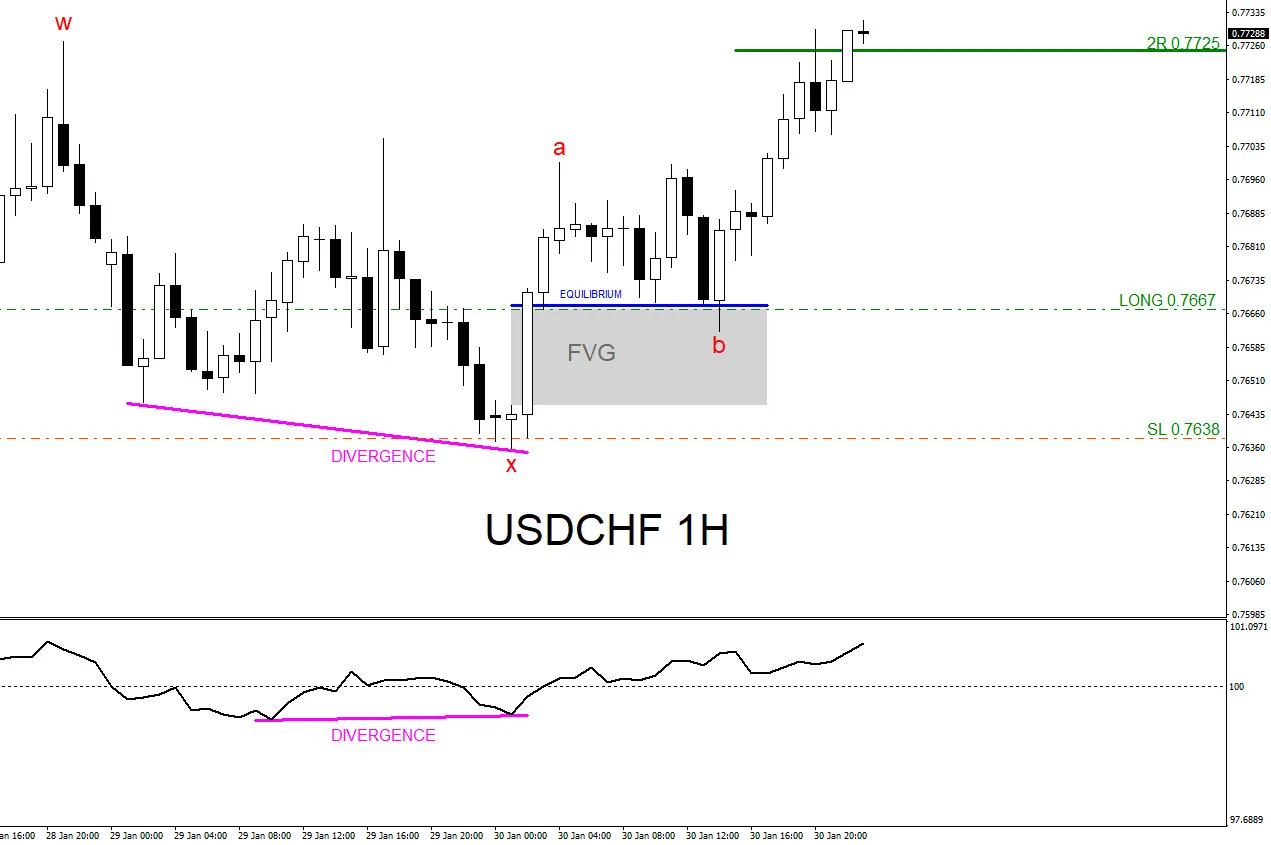
USDCHF moves higher and hits 2R target at 0.7725 where I closed buy position for +58 pips and a +2% profit gain. (Risking 1% on every trade)
A trader should always have multiple strategies all lined up before entering a trade. Never trade off one simple strategy. When multiple strategies all line up it allows a trader to see a clearer trade setup.
We at EWF never say we are always right. No market service provider can forecast markets with 100% accuracy. Only thing we at EWF 100%, is that we are RIGHT more than we are WRONG.
Of course, like any strategy/technique, there will be times when the strategy/technique fails so proper money/risk management should always be used on every trade.
Hope you enjoyed this article and follow me on social media for updates and questions> @AidanFX
At Elliottwave-Forecast we cover 78 instruments (Forex, Commodities, Indices, Cryptos, Stocks and ETFs) in 4 different time frames and we offer 5 Live Session Webinars everyday. We do Daily Technical Videos, Elliott Wave Trade Setup Videos and we have a 24 Hour Chat Room. Our clients are always in the loop for the next market move.