
Key takeaways
- Sharp drop, failed rebound: USD/JPY broke below 157.50 and slid 3% to a three-month low at 152.09 before rebounding, but the recovery toward 157 has now stalled, suggesting the bounce is losing steam.
- Politics didn’t weaken the yen as expected: Despite PM Takaichi’s landslide election win and scope for expansionary policies, the anticipated “Takaichi trade” faded quickly as intervention fears capped USD/JPY upside.
- Bearish technical inflection: Price action has formed a bearish engulfing pattern, with momentum rolling over; a break below 156.36 risks renewed downside toward 155.66–153.85, while 157.50 remains key resistance.
This is a follow-up analysis and an update of our prior report, “Chart alert: USD/JPY plunging below 158 on suspected intervention, watch 157.50 support”, published on 23 January 2026.
Since our last report, the USD/JPY has broken below the highlighted key support of 157.50 and staged a swift decline of around 3% within three days to print a three-month low of 152.09 on 27 January 2026.
Thereafter, the price actions of USD/JPY rebounded by 3.4% to hit a high of 157.27 last Friday, 6 February 2026, on the backdrop of a potential hawkish tilt that may be undertaken by the newly nominated Fed Chair, Kevin Warsh.
Also, in anticipation of favourable outcome for Japanese Prime Minister Takaichi’s coalition party performance on the 8 February snap election for the lower house, which allows her to have a stronger mandate to push for expansionary policies that will likely “hinder” the Bank of Japan (BoJ)’s current gradual interest rate hike monetary policy stance.
“Takaichi trade” on a weaker JPY gets fizzle out
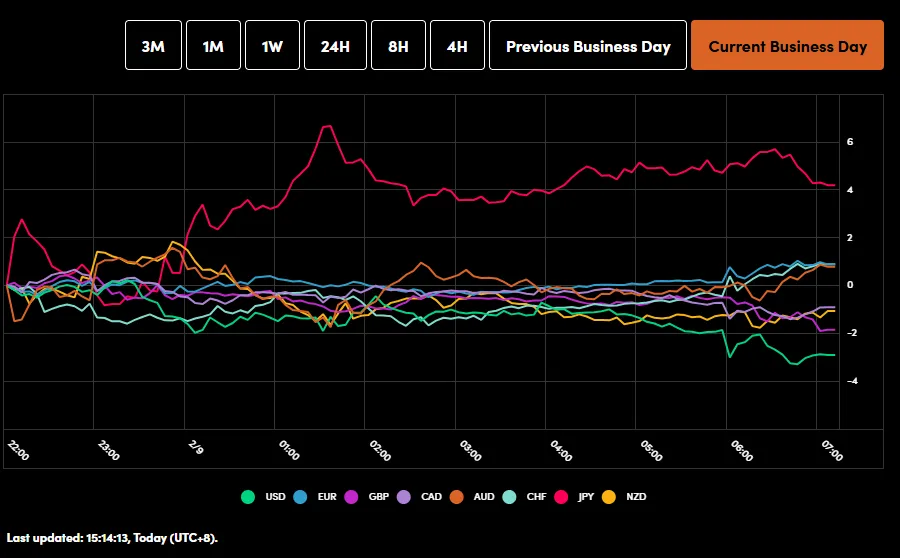
Fig. 1: OANDA Labs Currency Power Balance tool as of 9 Feb 2026 (Source: OANDA Labs tools)
Takaichi’s coalition party has managed to score a stunning victory in the snap election and surpassed the two-thirds majority of 310 seats, where Takaichi’s Liberal Democratic Party won 316 seats in the 465-seat chamber.
A super majority allows Takaichi’s coalition party to secure a majority on all parliamentary committees. A supermajority means it could overrule opposition to draft legislation in the upper house, which in turn allows Takaichi to push ahead with her campaign’s expansionary policies more easily.
On paper, such a scenario is likely to see a significant sell-off in the Japanese yen once the FX market reopens on Monday, 9 February early Asian session. In contrast, the earlier anticipated sell-off in the JPY was short-lived; the USD/JPY only spiked up by 42 pips to print an intraday high of 157.66 (slightly above the former broken-down key short-term support of 157.50) before it traded down lower by 0.5% to print a current intraday level of 156.50 at the time of writing where the JPY is now the strongest intraday major currency against the greenback (see Fig. 1).
Intervention fears put a halt to further intraday JPY weakness
Japanese Finance Minister Katayama reiterated on Sunday, as the election results came in favour of PM Takaichi’s coalition party, that she was keeping in close contact with US Treasury Secretary Bessent and pledged that she “will communicate” with financial markets today if needed.
These remarks have sparked fears in speculators of a joint intervention, and or rate checks if the USD/JPY rallied swiftly, triggering a déjà vu experience on the recent swift three-day sell-off of the USD/JPY from 23 January.
Let’s now look at the technical chart of USD/JPY to decipher its short-term trajectory.
Short-term trend (1 to 3 days): Inflection point reached for bearish reversal
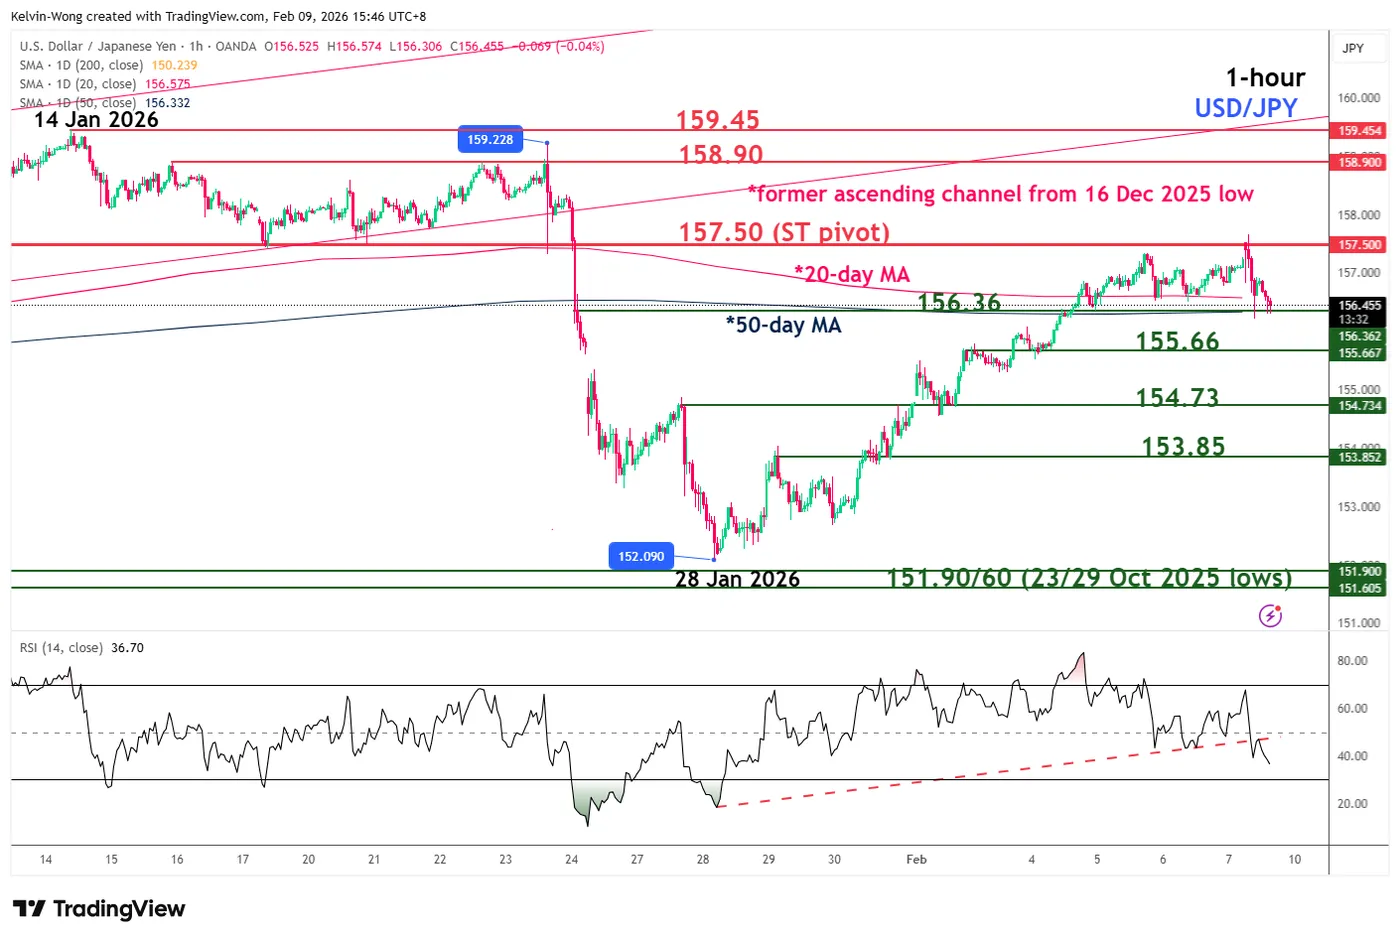
Fig. 2: USD/JPY minor trend as of 9 Feb 2026 (Source: TradingView)
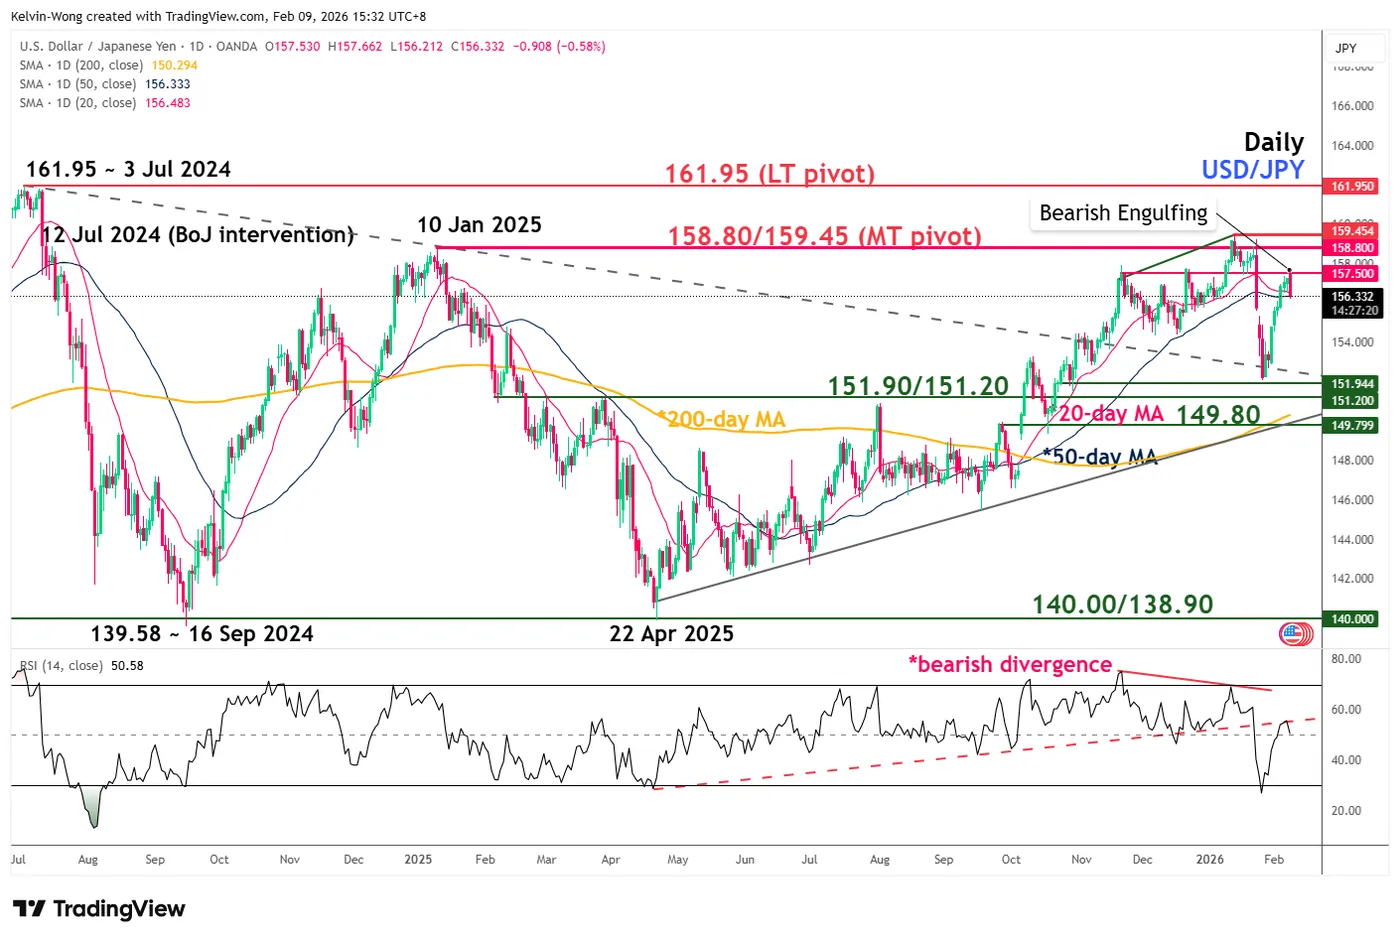
Fig. 3: USD/JPY medium-term trend as of 9 Feb 2026 (Source: TradingView)
USD/JPY’s rebound from the 28 January 2026 low of 152.09 is likely to have ended. Watch the 157.50 short-term pivotal resistance, and a break below 156.36 may trigger further short-term weakness to expose the next intermediate supports at 155.66, 154.73, and 153.85 (see Fig. 2).
However, a clearance above 157.50 invalidates the bearish scenario for a squeeze up towards 158.80/159.45 medium-term pivotal resistance zone.
Key elements to support the short-term bearish bias
- Based on the recent two sessions of price actions from 6 February to 9 February 2026, USD/JPY has formed an impending daily “Bearish Engulfing” candlestick pattern, which increases the odds of a bearish reversal (see Fig. 3).
- The hourly RSI momentum indicator has staged a bearish breakdown from its former parallel ascending support from 28 January 2026, which implies a potential build-up in short-term bullish momentum conditions.