
Silver is the only precious metal trading higher in today’s session, leaving traders with a sense of urgency: Is it time to enter at a discount, or is it better to stay away?
With tricky times ahead, it is essential to step back and develop a game plan to avoid traps.
The metals run was gigantic, spanning from mid-2024 to February, and it could still be early to call its end, with Gold back above $5,000.
The craziest part, however, is realizing that Silver was just around $32 a year ago, quite a change in value when we see $30 moves in just one volatile session these days.
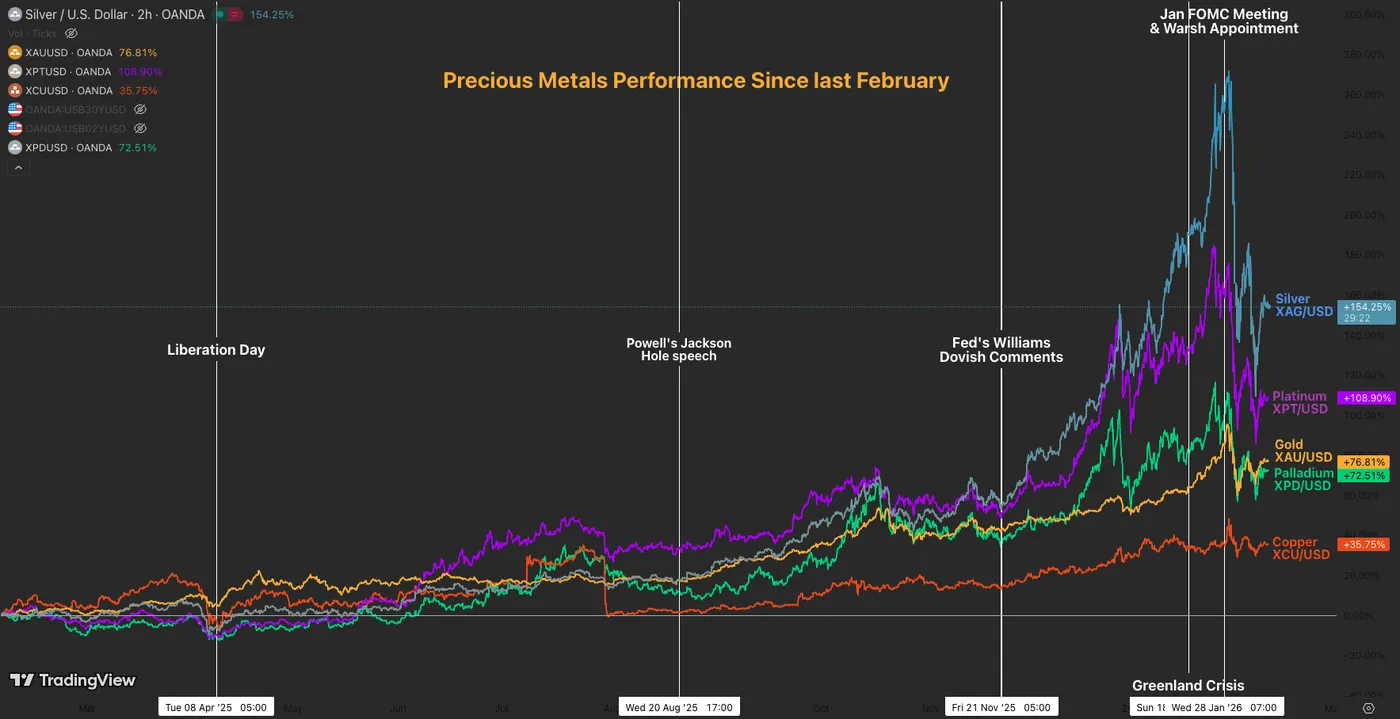
Metals performance since last February – Source: TradingView. February 10, 2026
Volatility is toning down with uncertainty still running high, and traders are looking to solve at least a few pieces of the puzzle throughout this week’s US Data.
Metals rebounded in the past session, benefiting from the dollar’s struggling denominator and participants’ reluctance to liquidate their safe-haven assets while the geopolitical picture remains blurry.
After this morning’s miss in US Retail Sales (0% vs 0.4% exp), Markets remain cautious ahead of tomorrow’s Non-Farm Payrolls and Friday’s CPI report before moving their pieces further.
If the data takes a dovish turn (missing expectations), the pricing for a Fed cut in March can change swiftly. It is currently priced around 20%.
Another tricky part will be the waiting between tomorrow’s release and Friday’s inflation report, but with latest Fed communications, there seems to be a certain tilt towards employment so NFP could lead the next trend in Metals.
We will dive into a Silver multi-timeframe analysis to prepare for Non-Farm Payrolls, with a few scenarios depending on tomorrow’s data. Let’s get right into it.
Silver (XAG/USD) Multi-timeframe Technical Analysis
Daily Chart
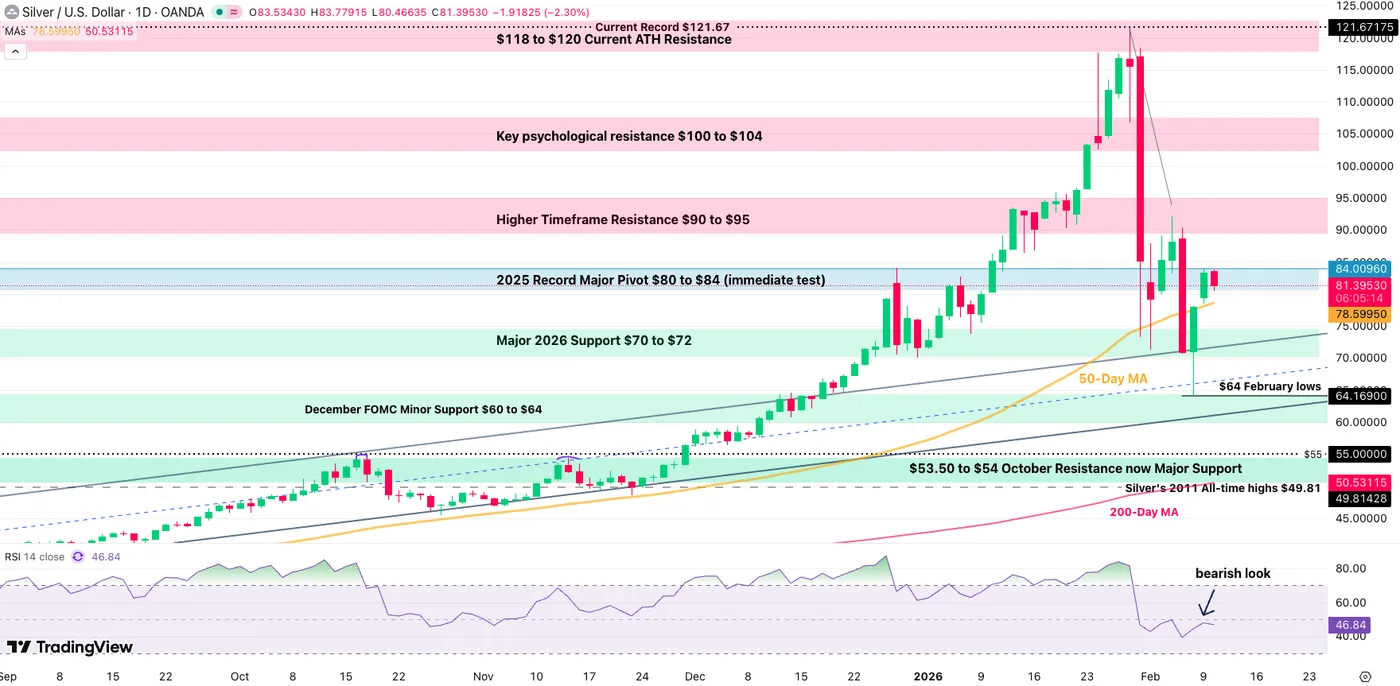
Silver Daily Chart, February 10, 2026 – Source: TradingView
The action on the daily is not showing much certainty, with Silver trading back above its 50-Day Moving Average but the RSI showing opposite, bearish rejection signs. Nevertheless, the past sessions bring prices back to interesting levels ahead of upcoming action.
Having troughed at $64, Silver is trading close to $20 higher in the establishment of a new intermediary trading range.
The higher timeframe $80 to $84 pivot serves as a guide for upcoming action.
- A dovish Non-Farm payrolls (anything below 40K, exp 70K) should fuel a rally above as traders price cuts: A session close above $84 should see continuation .
- Any as-expected release or higher than expected should see rejection of current levels. Any push below $80 should see continuation back towards the $70 to $72 Support zone. Depending on the extent of a beat, the price could even break the $64 lows.
- A risk-off event could push Silver higher, but flows would go more towards Gold in such scenario.
4H Chart and Technical Levels
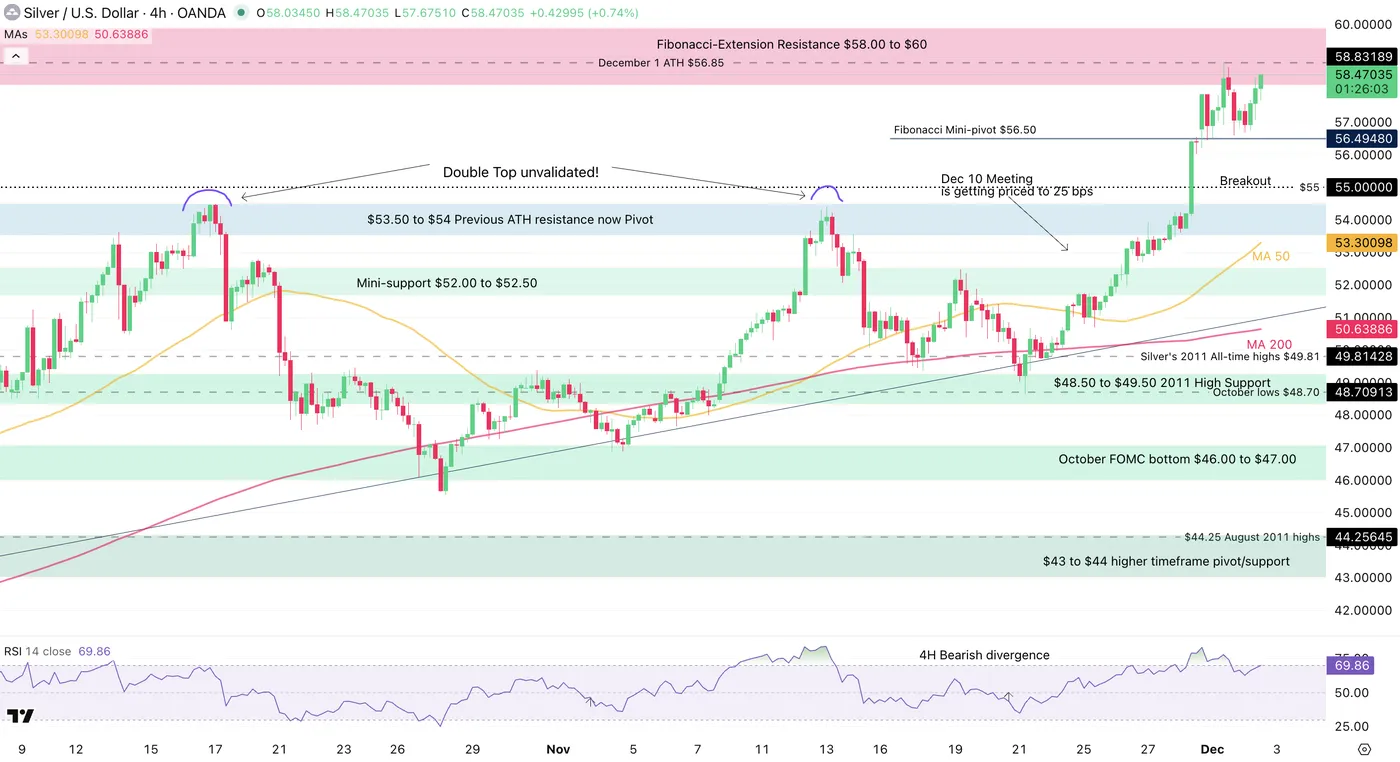
Silver 4H Chart, February 10, 2026 – Source: TradingView
Despite the rebound last week, it would be early to call for a resumption of the rally.
The 4H RSI is also pointing to a rejection ahead of the Non-Farm payroll, but the movement could stay calm before – Keep a close eye on the descending trendline.
Any break of the $70 support hints first at a retest of the $60 to $64 support.
Any move below would require an updated analysis, but traders can look at the $50 to $54 Major Support.
Levels to watch for Silver (XAG) trading:
Resistance Levels:
- 2025 Record Major Pivot $80 to $84 (immediate rejection)
- Session Highs $84
- Higher Timeframe Major Resistance $90 to $95
- Feb 4 highs $92.20
Support Levels:
- Major 2026 Support $70 to $72
- December FOMC Minor Support $60 to $64 (Feb Lows)
- $50 to $54 Major Support
- October FOMC bottom $46.00 to $47.00
- $45.55 October 28 lows
1H Chart
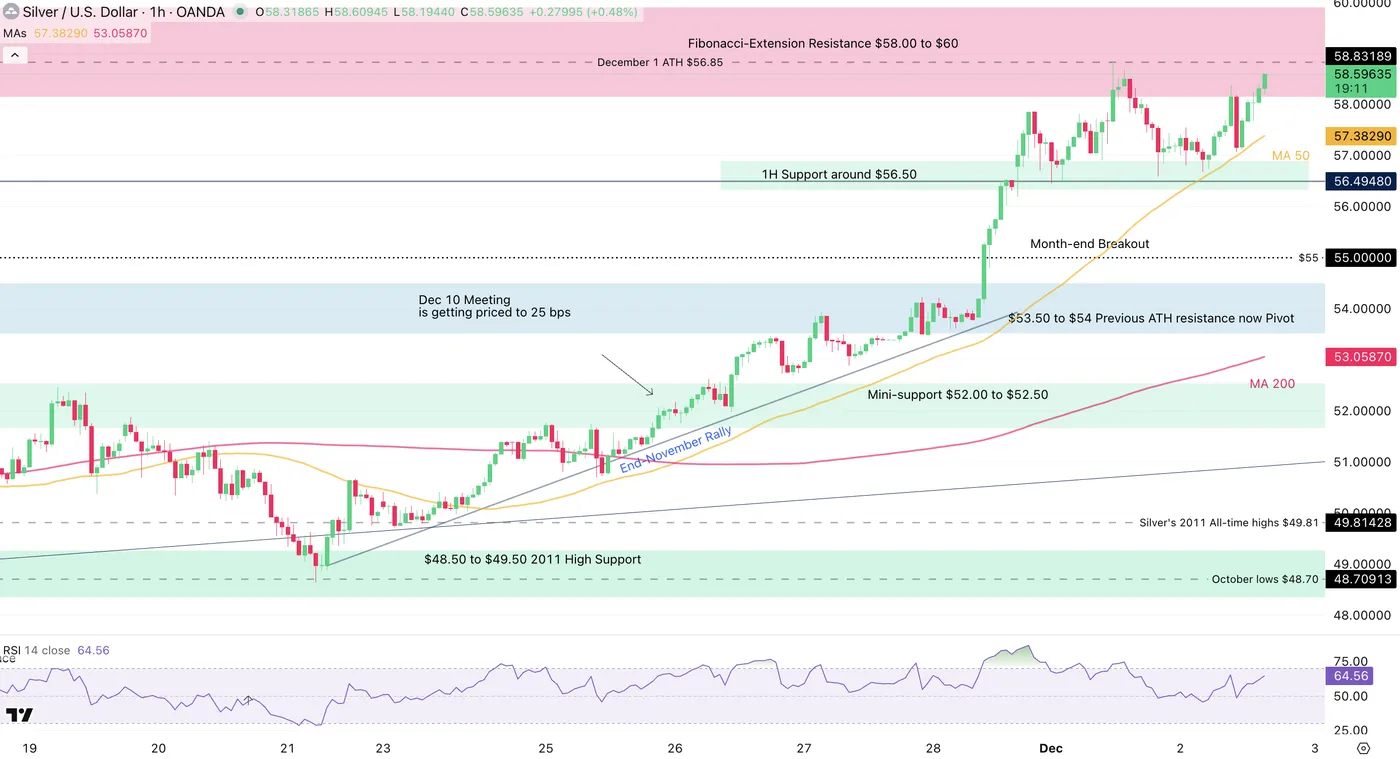
Silver 1H Chart, February 10, 2026 – Source: TradingView
The immediate action looks toppy but to be even more realistic, looks like there won’t be much action this afternoon.
Except for a small intraday Head & Shoulders forming, pointing to $77 Silver throughout the session (first need to breach the 50H MA), the wisest position to take is to wait for tomorrow before looking for direction.
In the meantime, the most impatient can expect a $77 to $83 range ahead of tomorrow’s NFP release (8:30 A.M. ET)
Safe Trades and Happy 10th of February (it’s my birthday)!