
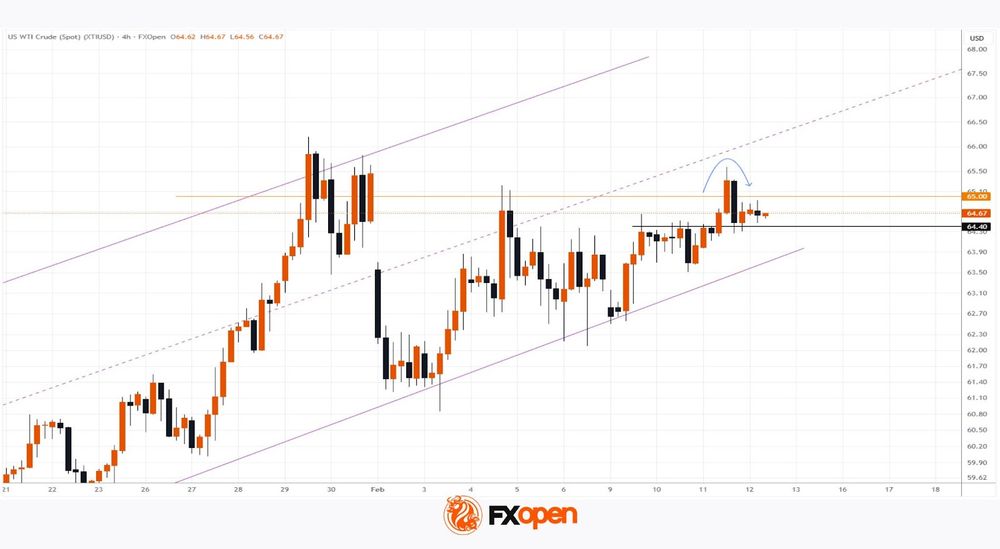
As the XTI/USD chart shows, the price per barrel moved above the 4 February peak yesterday, marking its highest level since the start of the month. The bullish sentiment has been driven by geopolitical uncertainty. According to media reports:
→ The Trump–Netanyahu meeting in Washington on 10–11 February failed to ease tensions. Despite Omani mediation and statements suggesting a “near compromise”, no formal agreement has yet been reached.
→ Reports of a possible deployment of additional US carrier strike groups to the Middle East have added to market nerves. Any escalation could threaten supplies through the Strait of Hormuz, which accounts for around 20% of global oil consumption.
While the fundamental backdrop remains tense and continues to support higher oil prices, the chart simultaneously points to vulnerability to a pullback.
Technical Analysis of the XTI/USD Chart
When analysing the WTI oil chart on 5 February, we:
→ used recent price swings to construct a broad ascending channel (shown in purple), noting that its lower boundary was acting as support;
→ suggested that the $65 level would become a key obstacle for bulls attempting to maintain upward momentum.
Recent price action supports this view, as:
→ if yesterday’s move above the 4 February high is treated as a bullish breakout, it appears to have failed — a potential bull trap;
→ a bearish engulfing reversal pattern has formed on the chart (indicated by the arrow).
It is noteworthy that many investment bank analysts consider current WTI prices to be overstretched, forecasting a decline towards the $57–59 range due to oversupply. However, such a scenario would likely require a reduction in geopolitical risk.
In light of the above, it is reasonable to assume that the initiative may now be shifting to the bears, who could attempt to push prices towards the lower boundary of the channel. The $64.40 level — which acted as resistance last week — now appears to offer local support.
Start trading commodity CFDs with tight spreads (additional fees may apply). Open your trading account now or learn more about trading commodity CFDs with FXOpen.
This article represents the opinion of the Companies operating under the FXOpen brand only. It is not to be construed as an offer, solicitation, or recommendation with respect to products and services provided by the Companies operating under the FXOpen brand, nor is it to be considered financial advice.