
Key takeaways
- Dow pulls back after fresh highs: The Dow Jones hit a new all-time high near 50,335 but has since slipped back toward its 20-day moving average as broader US indices post week-to-date losses, led by renewed weakness in technology stocks.
- Tech drag, defensives hold firm: The sell-off was driven mainly by the tech sector, with Cisco plunging 12%, while defensive sectors such as Consumer Staples and Utilities outperformed.
- Recovery hinges on key levels: Holding above 49,265 support keeps the rebound scenario alive, with a break above 49,940 opening room to retest record highs; failure below support risks a deeper pullback toward the 50-day moving average near 48,900/48,710.
This is a follow-up analysis and an update of our prior report, “Dow Jones (DJIA) Forecast: Eyeing new all-time high as banks’ earnings loom”, published on 13 January 2026.
Since our last analysis, the Dow Jones Industrial Average has managed to scale a fresh all-time high in February and hit our highlighted resistance of 50,265/50,335.
US stock indices are the worst performers so far this week
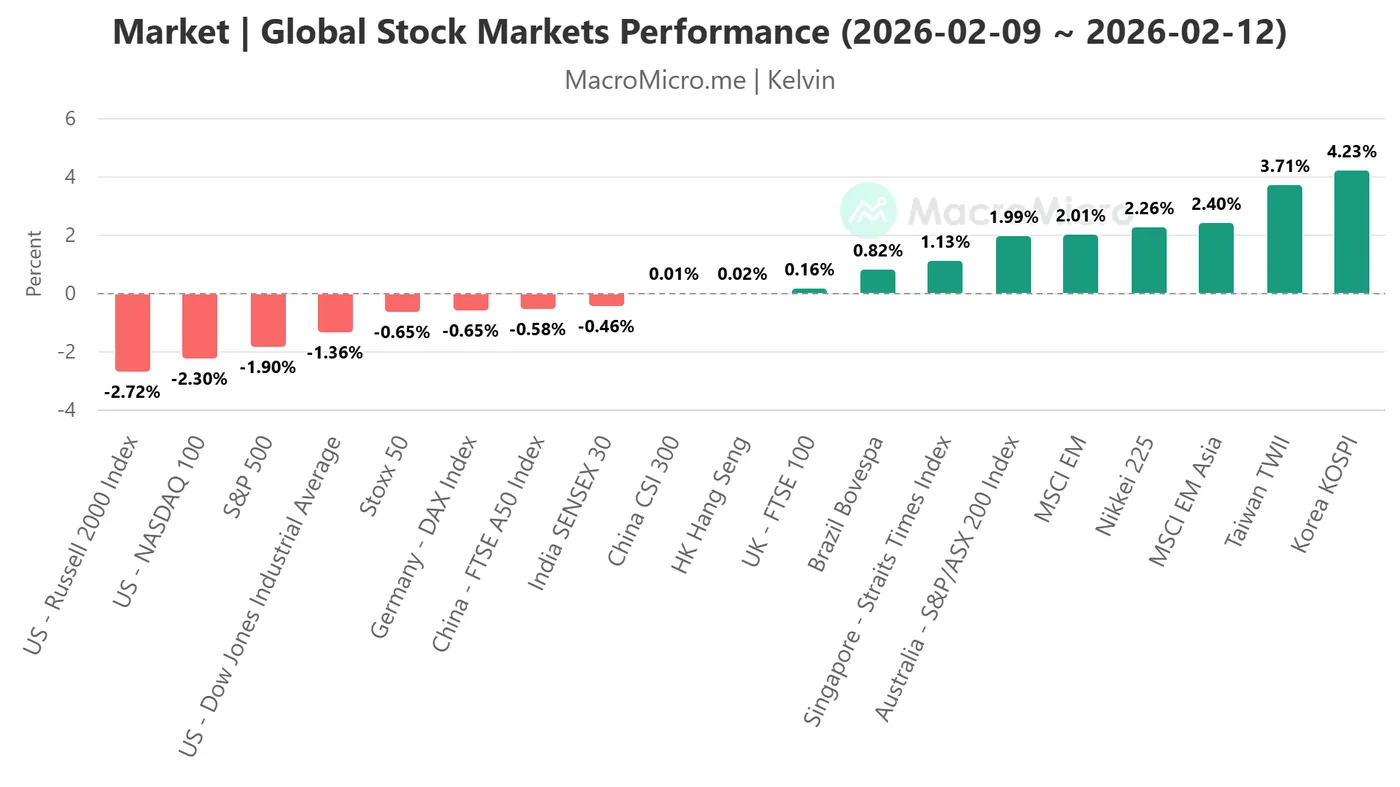
Fig. 1: Global stock indices week-to-date performances as of 12 Feb 2026 (Source: MacroMicro)
The US stock market is on track to end the week on a weaker footing, where all four major US benchmark stock indices have recorded week-to-date losses as of Thursday, 12 February 2026; Dow Jones Industrial Average (-1.4%), S&P 500 (-1.9%), Nasdaq 100 (-2.3%), and small-caps Russell 2000 (-2.7%) (see Fig. 1).
Yesterday’s opening hours gains at the start of the US session evaporated and transformed into an almost broad-based selling across the board, except for the defensive sectors in the S&P 500 that bucked against the bearish trend; Consumer Staples (+1.4%) and Utilities (1.2%).
The main catalyst for the weak performance has been renewed weakness seen in the technology stocks; the S&P 500 Technology sector was the worst performing sector on Thursday (-2.6%), dragged down by Cisco Systems, which plummeted by 12%, its worst single day drop in nearly four years, with its warning that higher memory costs will be adversely affect its profit margins.
The short-term technical chart of the US Wall Street 30 CFD Index (a proxy of the Dow Jones Industrial Average futures) is now showing some signs of stabilization after yesterday’s sell-off.
Let’s examine the short-term trajectory of the US Wall Street 30 CFD Index and its supporting elements.
Short-term trend (1 to 3 days): Potential recovery at 20-day moving average
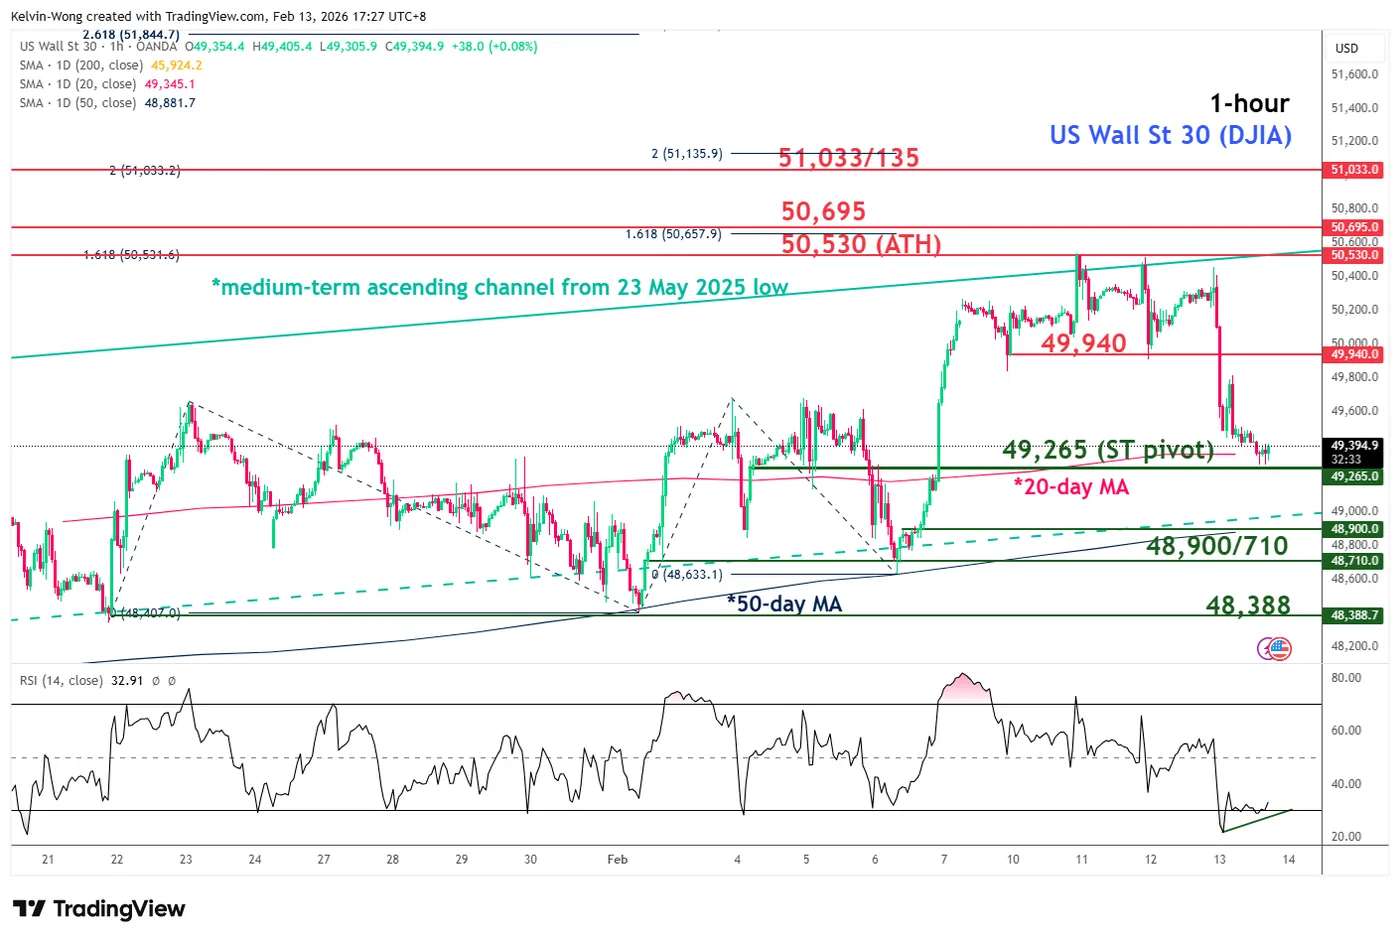
Fig. 2: US Wall Street 30 CFD index minor trend as of 13 Feb 2026 (Source: TradingView)
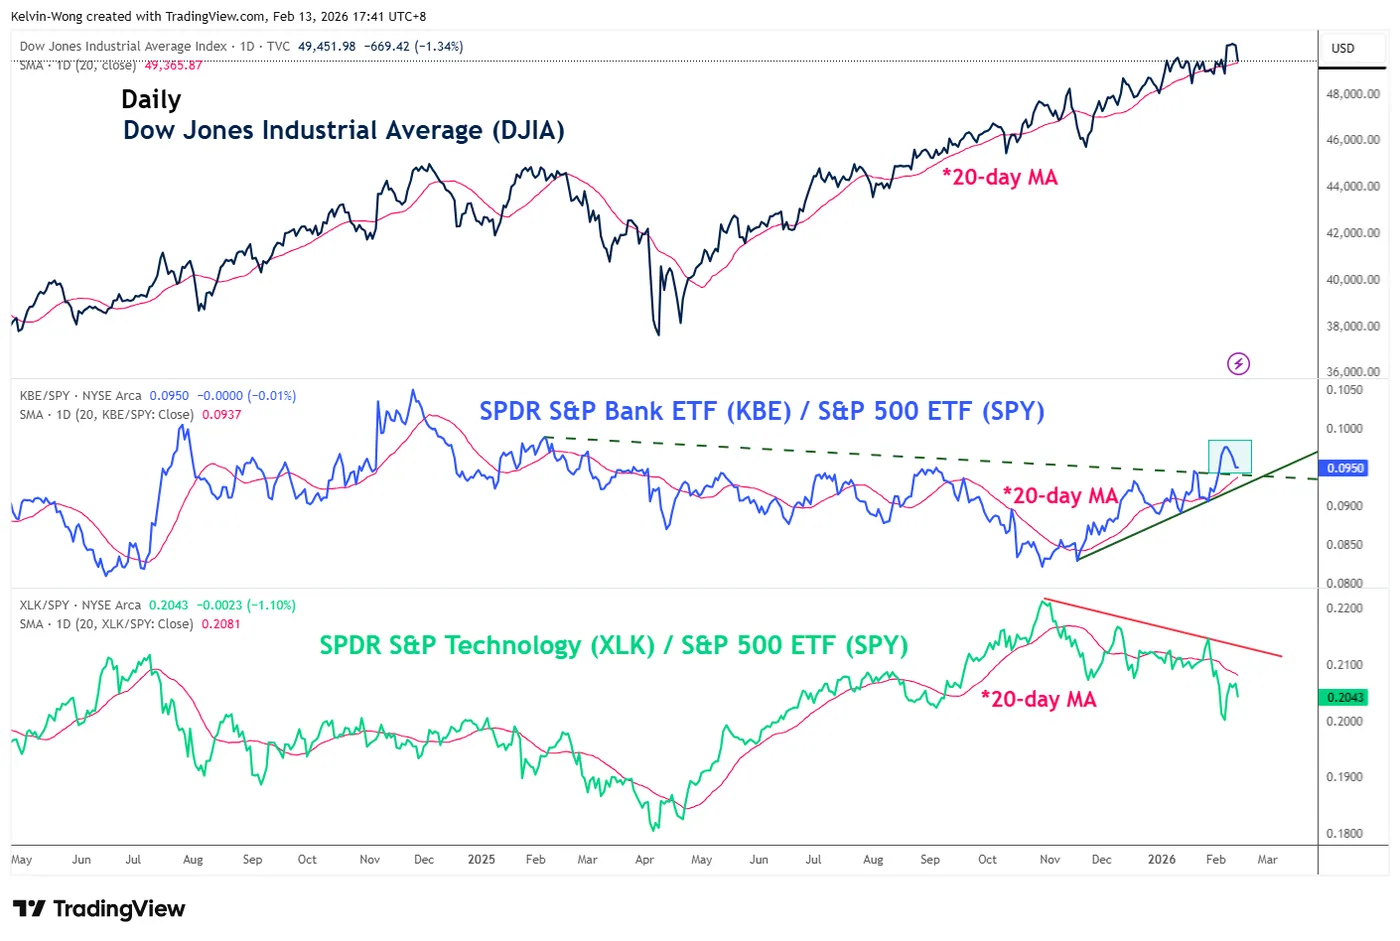
Fig. 3: Ratio chart of S&P Banks ETF over S&P 500 ETF as of 12 Feb 2026 (Source: TradingView)
Watch the 49,265 key short-term pivotal support on the US Wall Street 30 CFD Index, and clearance above 49,940 upside trigger level increases the chances of the recovery to retest the current all-time high area of 50,530 printed on 10 February 2026, before the next intermediate resistance comes in at 50,695 (Fibonacci extension) (see Fig. 2).
On the flip side, a break below 49,265 invalidates the bullish scenario for a deeper minor corrective decline to extend further towards the next intermediate support at 48,900/48,710 (also the 50-day moving average) in the first step.
Key elements to support the short-term bullish bias
- The hourly RSI momentum indicator of the US Wall Street 30 CFD index has flashed out a bullish divergence condition at its oversold region (see Fig. 2).
- The US financial sector, with a weightage of around 28%, is the largest weighted component in the Dow Jones Industrial Average (DJIA).
- The ratio chart of the SPDR S&P Bank ETF over the S&P 500 ETF has traded above a key ascending support since 17 November 2025, which suggests the medium-term outperformance of US banks remains intact, in turn, supporting a recovery on the US Wall Street CFD index at this juncture (see Fig. 3).