
As today’s XAU/USD chart shows, the price of gold has dropped below the lows of 12 February, marking its weakest level in ten days. According to media reports, several factors are weighing on bullion:
- → Easing geopolitical tensions. Safe-haven demand has diminished amid US–Iran and Russia–Ukraine negotiations.
- → Slowing US inflation. This may be prompting traders to reassess expectations for Federal Reserve policy in 2026.
- → The holiday effect. With Presidents’ Day in the US and Lunar New Year celebrations in Asia, trading volumes have declined. In such thin market conditions, prices can become more vulnerable to speculation and abrupt moves.
On 9 February, when analysing gold price movements, we:
- → confirmed the validity of the long-term ascending channel;
- → noted that following a spike in extreme volatility at the turn of the month, the market could begin seeking a new equilibrium;
- → suggested a scenario involving a contraction in price swings on the XAU/USD chart, with the potential formation of temporary balance between supply and demand around the psychological $5k mark.
Indeed, from 9 to 12 February the market formed a consolidation zone slightly above $5k — more precisely, between resistance R1 and local support S1.
Technical Analysis of the XAU/USD Chart
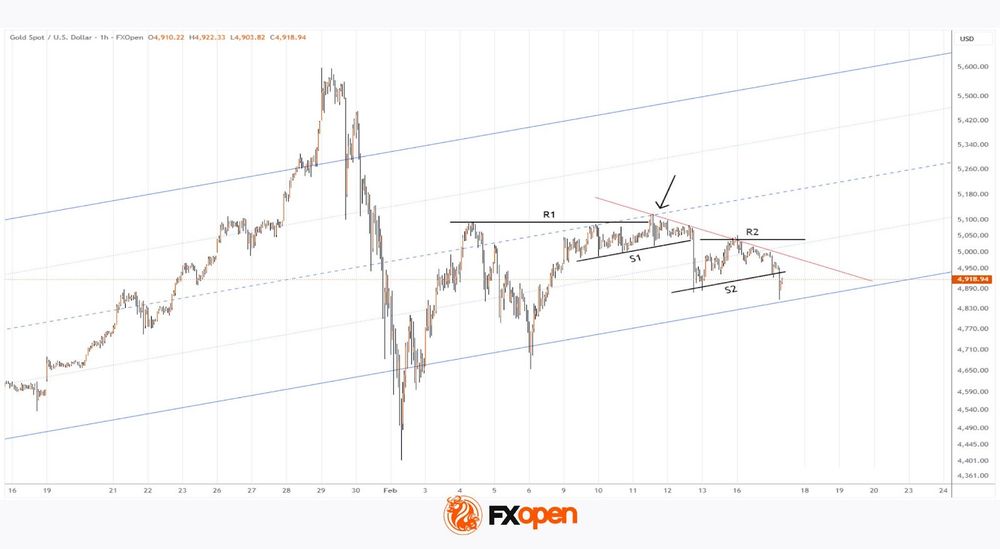
A false bullish breakout (indicated by the arrow) highlighted the bulls’ inability to sustain momentum and effectively became a trap for buyers.
This, in turn, allowed bears to attempt to seize the initiative, resulting in a successful break below the S1 level. Subsequently, the breached level acted as resistance (R2).
Today’s decline on the XAU/USD chart suggests that:
- → bears remain in control, as evidenced by the break of local support S2;
- → a key argument in favour of the bulls may come from the major support at the lower boundary of the long-term channel.
In February, the market has already twice returned within the boundaries of the long-term upward channel. It cannot be ruled out that the price will remain inside it. Notably, if a decisive break above the resistance line (shown in red) occurs, this could reasonably be interpreted as a breakout of a bullish flag pattern.
Start trading commodity CFDs with tight spreads (additional fees may apply). Open your trading account now or learn more about trading commodity CFDs with FXOpen.
This article represents the opinion of the Companies operating under the FXOpen brand only. It is not to be construed as an offer, solicitation, or recommendation with respect to products and services provided by the Companies operating under the FXOpen brand, nor is it to be considered financial advice.