
- GBP/USD has broken a key ascending trendline, potentially leading to a 470-pip decline.
- The four-hour chart RSI is oversold, hinting at a short-term rebound before a potential continuation of the downtrend.
- If the current US Dollar rally wanes, this could see the potential setup face significant headwinds.
- The bearish setup is invalidated if the daily candle closes above the 1.3700 swing high.
GBP/USD has continued to slide thanks in part to the US Dollar resurgence this week as well as renewed hopes of rate cuts from the Bank of England (BoE).
Scenario 1
Cable has been on a downward trend printing lower highs and lower lows since the peak of 1.38700 printed on January 27, 2026.
The pair has staircased its way lower since then and has finally breached the medium-term ascending trendline with a daily candle close yesterday.
This sets up a potential drop of as much as 470-odd pips moving forward.
GBP/USD Daily Timeframe, February 19, 2026
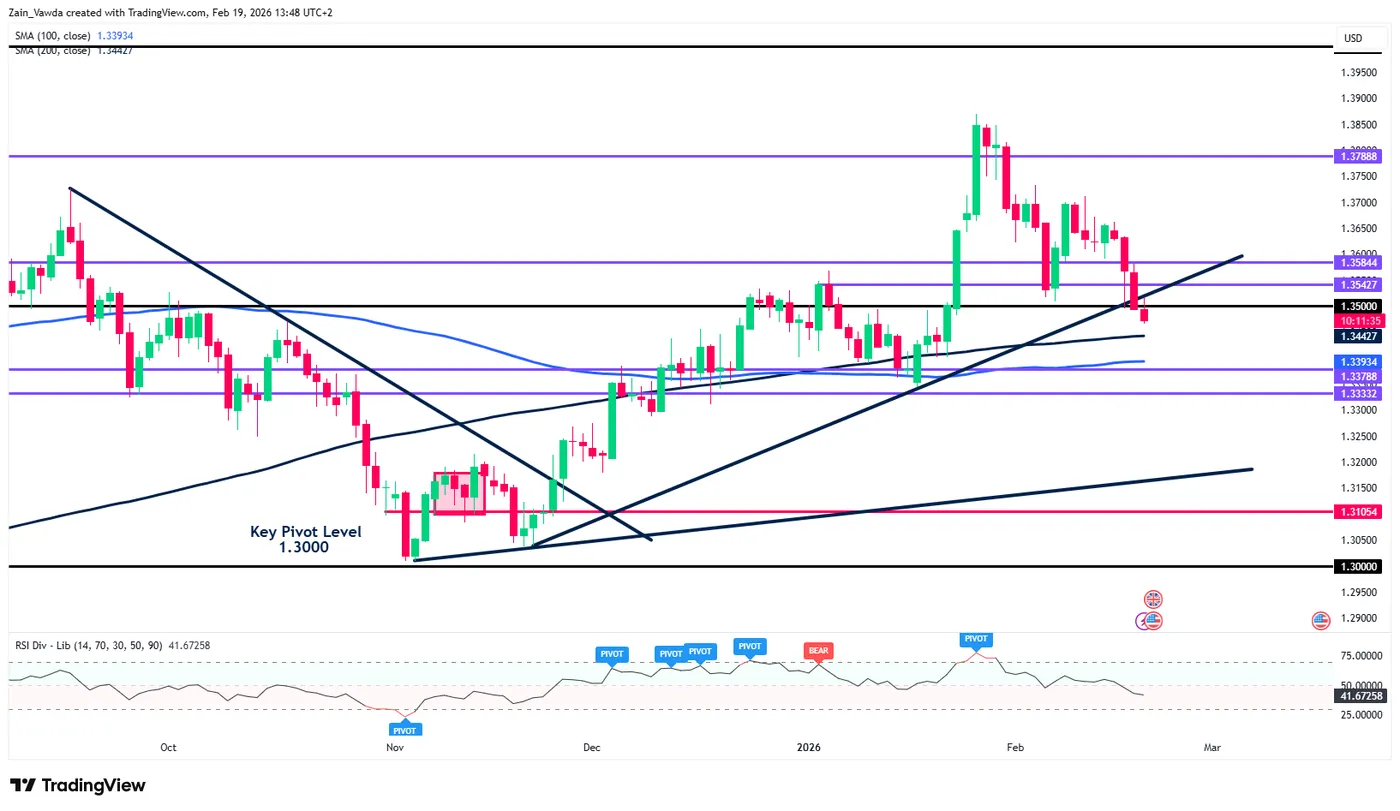
Source: TradingView
Dropping down to a four-hour chart, GBP/USD is printing a fresh low while the RSI-period 14 hovers in oversold territory.
That is a concern and may hint at a pullback in the near-term before a bearish continuation.
Keep an eye on the swing highs around 1.3573 and potentially 1.3651 which lines up with the 100-day MA on the H4 chart.
GBP/USD Four-Hour Timeframe, February 19, 2026
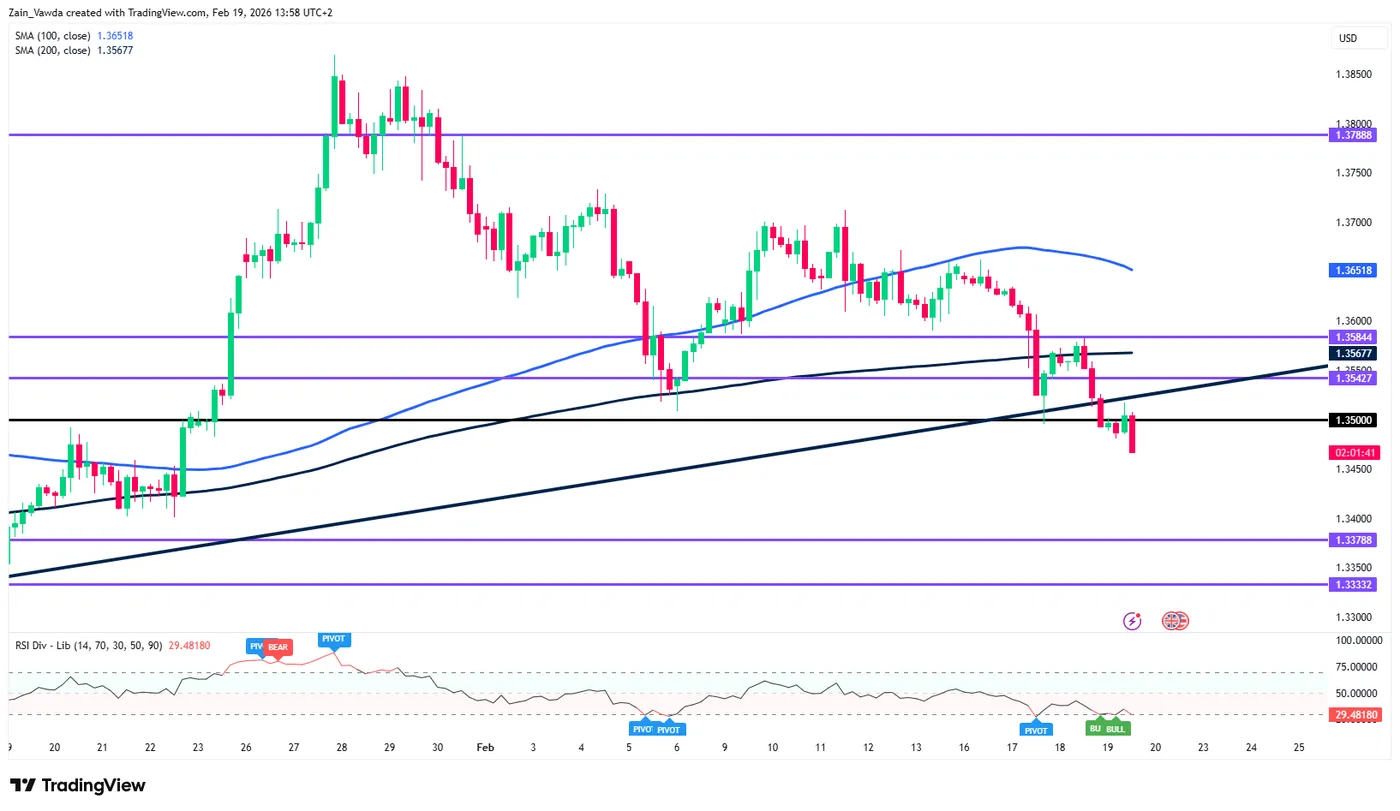
Source: TradingView
Scenario 2
The concern for this setup is the US dollar which is enjoying a renaissance this week which has driven a part of this breakout.
Later today markets will focus on US data releases of initial jobless claims and the December trade surplus report.
If today’s data confirms a narrower-than-expected deficit for December, it would likely boost growth projections for the fourth quarter of 2025 and provide the US dollar with a short-term lift.
Despite this potential for a bounce, the broader outlook for the greenback remains challenged. While the US Dollar Index (DXY) may drift toward the 98.00 level on positive data, a pervasive “sell the rally” sentiment continues to dominate the market.
Many market participants expect the currency’s strength to be fleeting, as long-term expectations for Federal Reserve policy and global trade shifts maintain downward pressure on the dollar’s overall trajectory.
This overarching theme around the US dollar is a major concern and could be the one to scupper a potential deeper selloff in GBP/USD.
In order for the bearish setup to be invalidated, a daily candle close above the 1.3700 swing high on the daily chart is needed to put bulls back in control.
GBP/USD Daily Timeframe, February 19, 2026
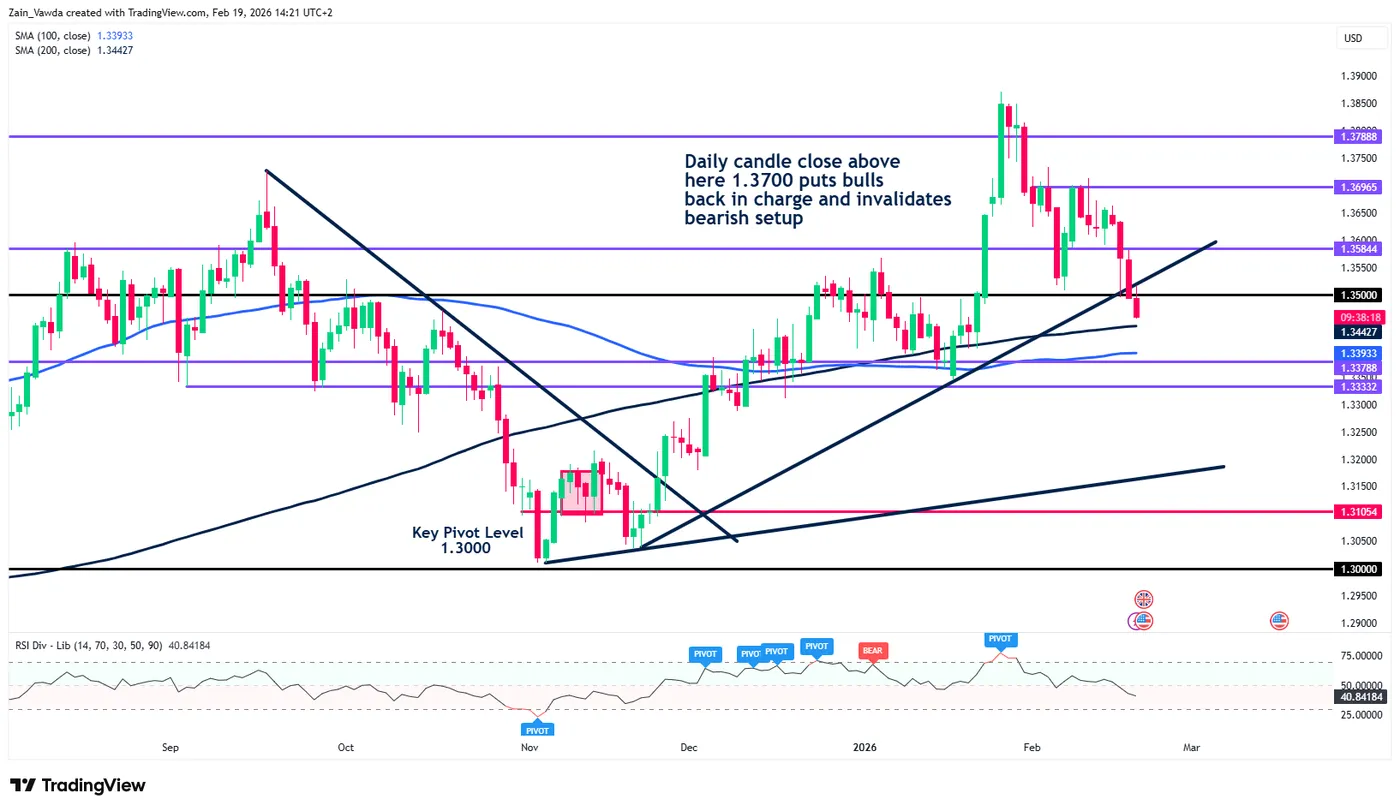
Source: TradingView
Safe Trades XX.