
Key takeaways
- Gold pulls back despite geopolitical tensions: Gold (XAU/USD) is down about 3% for the week after an earlier 20% four-week rally, even though the US–Iran war 2026 initially pushed prices to a record $5,420 intraday high.
- Rising real yields cap gold’s upside: A 21% surge in West Texas Intermediate crude oil lifted inflation expectations, pushing the US 10‑year Treasury real yield up by ~20 bps, increasing the opportunity cost of holding non-yielding gold and dampening its safe-haven rally.
- Technical setup suggests possible rebound: Gold is holding near key support around $5,046 (20-day moving average and Fibonacci support). If prices break above $5,280, a bullish move toward $5,448 could follow, while a drop below $5,046 risks deeper downside toward $4,960–$4,842.
The prior 4 weeks of positive returns seen in Gold (XAU/USD) from the week of 2 February 2026 to the week of 23 February 2026, where the precious yellow metal staged an accumulated gain of 20% (low to close during the 4 weeks).
Right after the first salvo of missiles fired jointly by the US and Isreal in the current US-Iran war, Gold (XAU/USD) gapped up on Monday, 2 March 2026, at the start of the Asian session with an intraday rally of 2.7% to print an intraday high of $5,420 (also the highest level traded so far this week at the time of writing).
Gold is trading at a loss despite rising geopolitical risk premiums from US-Iran war
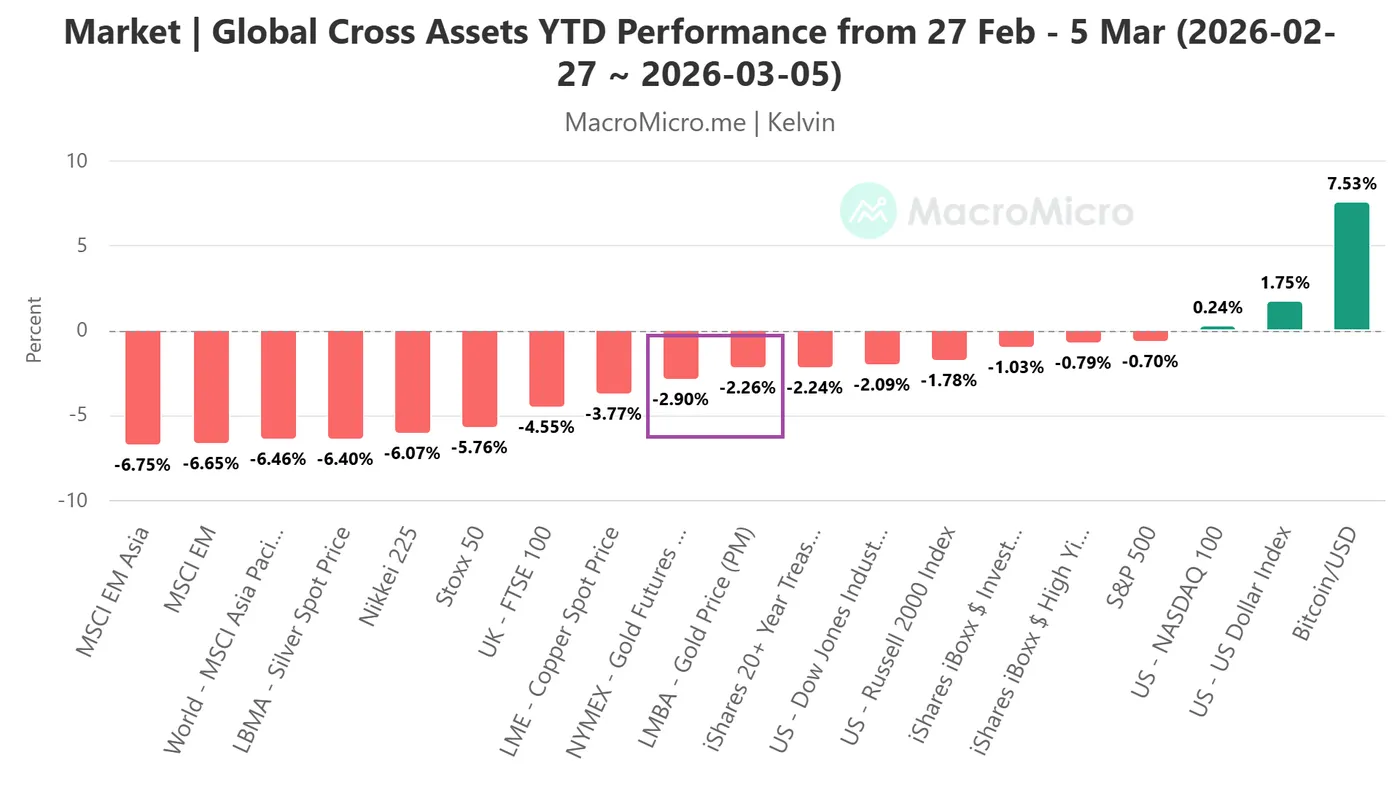
Fig. 1: Key global cross-asset performances from 27 Feb 2026 to 5 Mar 2026 (Source: MacroMicro)
Thereafter, bullish momentum tapered off, and Gold (XAU/USD) is now trading at a week-to-date loss of 3% at the time of writing.
Also, based on last Friday’s 27 February closing levels to Thursday, 5 March prices, LMBA spot Gold and NYMEX Gold futures have recorded losses of -2.3% and -2.9% respectively (see Fig. 1).
The primary reason for Gold not staging a similar pace of gains seen in West Texas crude oil, Brent, and LNG amid rising geopolitical risk premiums is due to the fear of stagflation risk that may put the current expectations of two interest rate cuts (a total of 50 basis points) by the US Federal Reserve in jeopardy, that also implies a rising risk of higher opportunity cost for holding Gold which is a non-interest income bearing asset.
Higher oil prices have triggered a jump in 10-year US Treasury real yield
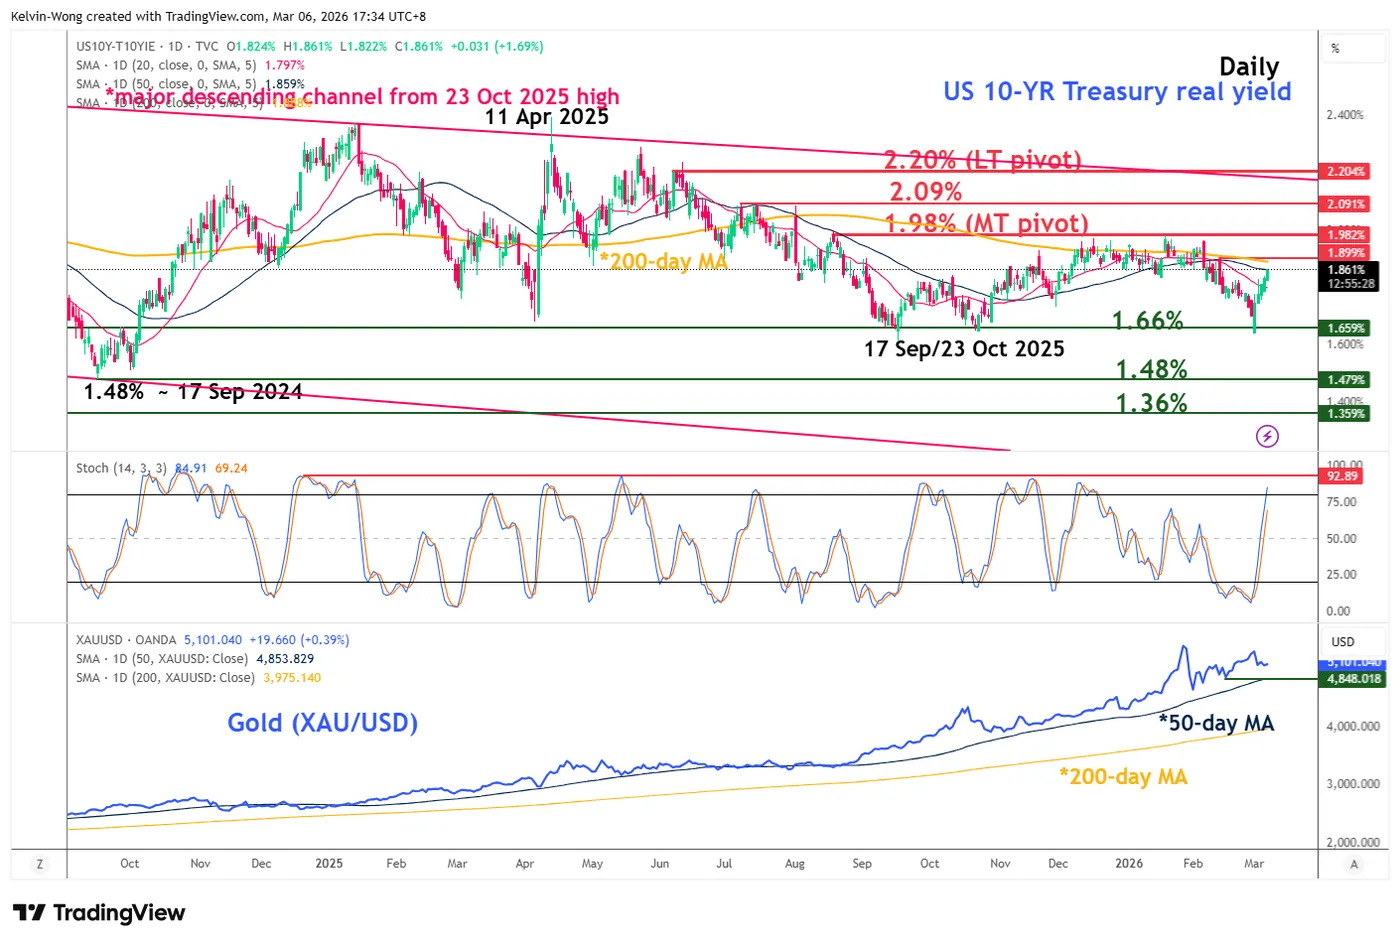
Fig. 2: 10-year US Treasury real yield medium-term trend with Gold (XAU/USD) as of 6 Mar 2026 (Source: TradingView)
Higher oil prices seen this week (WTI crude jumped by 21%) have increased inflationary expectations, in turn, triggering a rise of 20 basis points (bps) in the 10-year US Treasury real yield (10-year US Treasury nominal yield minus 10-year US breakeven inflation rate) from its medium-term range support of 1.66% to a current level of 1.86% (see Fig. 2).
Interestingly, the current rally in the 10-year US Treasury real yield is now back close to the 200-day moving average (1.9%), and the key range resistance of 1.98% that capped prior rallies in check since 19 August 2025.
In addition, its daily Stochastic oscillator has reached its overbought region of above 80, which suggests that the current up move in the 10-year US Treasury real yield may start to taper off, in turn, allowing Gold (XAU/USD) to stage at least a minor bullish reversal at this juncture.
Let us now dissect the short-term trajectory (1 to 3 days) of Gold (XAU/USD) from a technical analysis perspective.
Gold (XAU/USD) – Holding at the 20-day moving average support
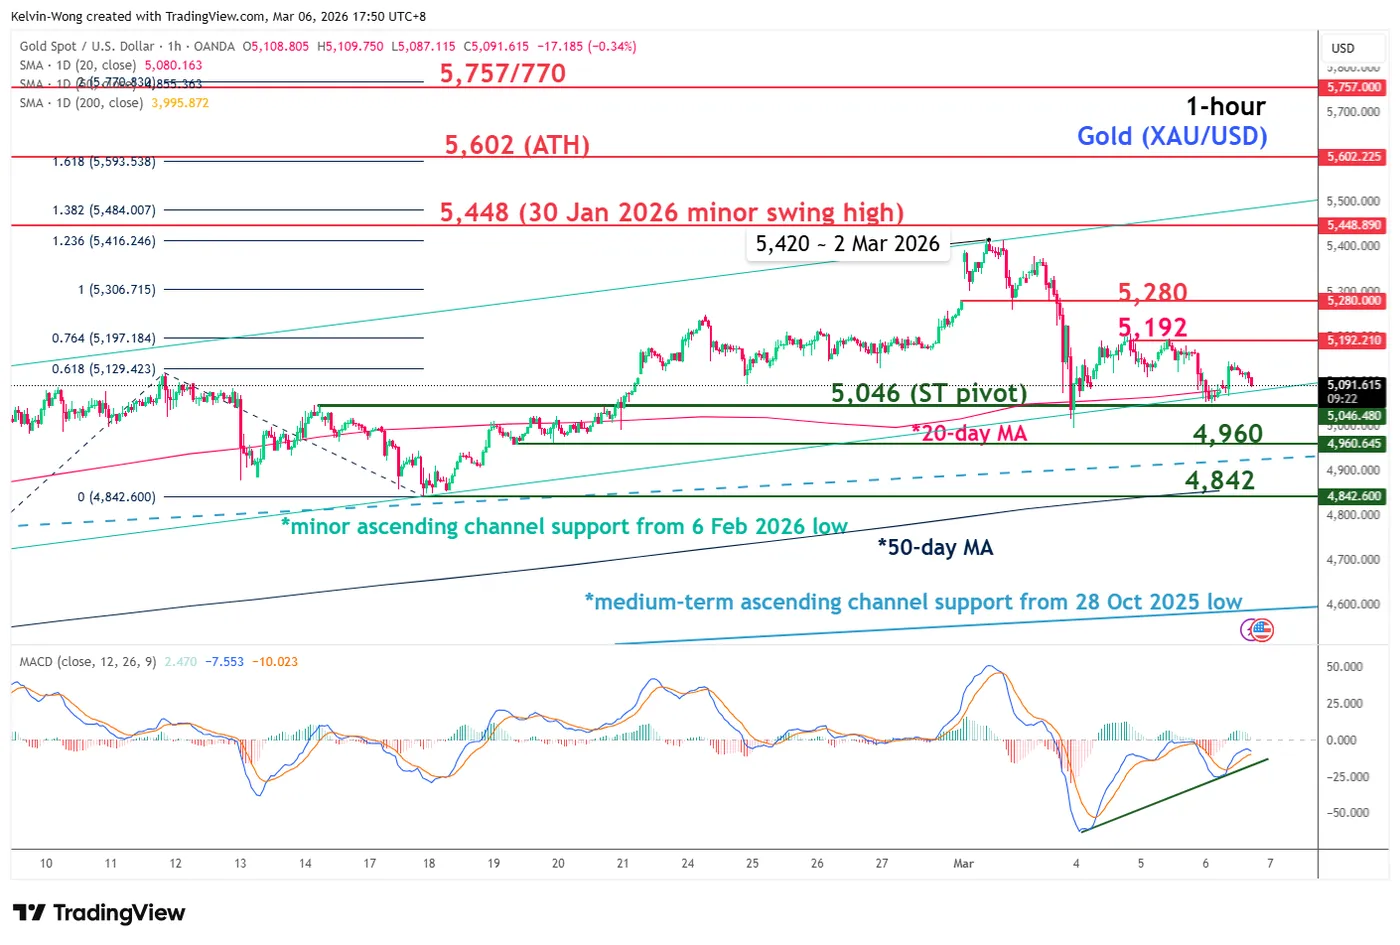
Fig. 3: Gold (XAU/USD) minor trend as of 6 Mar 2026 (Source: TradingView)
Watch the $5,046 key short-term pivotal support on Gold (XAU/USD) for a potential minor bullish reversal scenario, with the next intermediate resistances coming in at $5,192 and $5,280 (see Fig. 3).
A clearance above $5,280 is likely to see the bulls gaining traction to kickstart a minor bullish impulsive up move sequence for the next resistance to come in at $5,448 in the first step
However, a break and an hourly close below $5,046 invalidates the bullish reversal scenario for a further corrective slide towards the next intermediate supports at $4,960 and $4,842 (also the 50-day moving average).
Key elements to support the bullish bias on Gold (XAU/USD)
- The $5,046 key short-term support confluences with the 20-day moving average, minor ascending channel support, and the 61.8% Fibonacci retracement of the prior minor rally from the 17 February 2026 low to the 2 March 2026 high.
- The hourly MACD trend indicator has formed a “higher low” (bullish divergence condition) below its centreline, which suggests that the current bearish momentum may have eased.


 is down about 3% for the week after an earlier 20% four-week rally, even though the US–Iran war 2026 initially pushed prices to a record $5,420 intraday high.)