
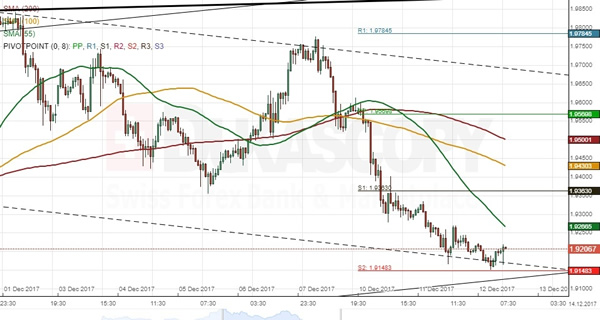
The Sterling has been trading in a long-term channel up against the New Zealand Dollar since September, 2016. The Pound tested its upper boundary two weeks ago prior to starting a new wave down. As apparent on the chart, the Pound is located near the bottom boundary of a medium-term channel which has been guiding the given currency during its latest up-wave. Thus, two scenarios are possible. On the one hand, the pair might breach this medium pattern southwards and thus continue depreciating towards the senior channel circa 1.88. On the other hand, technical indicators suggest that the rate might still go for another price increase. A possible upside target is the 200-hour SMA and the weekly PP circa 1.9550. The 55– and 100-hour SMA could also provide some resistance along the way.


