
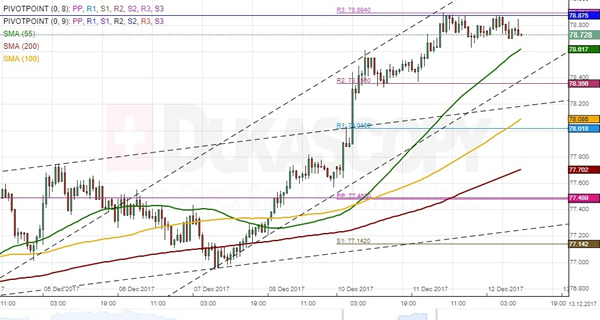
The dominant pattern which has guided NZD/JPY for the last two years is an ascending channel. The pair bounced off its upper boundary mid-July and has since been driven by bearish momentum. During the past four weeks, the Kiwi has been gradually moving towards the upper boundary a new medium-term pattern circa 80.50; thus, this upward movement might hold for the following weeks, as well. In the short term, however, the pair has failed to move above the combined resistance of the monthly R1 and the weekly R3 near the 78.88 mark. This suggests that a possible decrease in price might be due soon. The ultimate downside target for this week could be the weekly and monthly PPs at 77.50, while the 55-, 100– and 200-hour SMAs are likely to provide support for some time or even reverse the rate.


