
Gold prices stabilised around 4,830 USD per ounce on Thursday following a sixth consecutive decline, marking the longest losing streak since late 2024. The market remains under pressure from the Federal Reserve’s hawkish stance, which currently outweighs geopolitical risks.
The Fed held rates unchanged and signalled only one cut this year. Jerome Powell emphasised that policy easing would only be possible with a more confident slowdown in inflation. The central bank also noted increased uncertainty amid the Middle East conflict, indicating that rising energy prices could add to inflationary pressure.
Tensions escalated further following Iranian missile strikes on a facility in Qatar housing the world’s largest LNG infrastructure. The action was reportedly in retaliation for Israel’s recent attack on the South Pars gas field.
While geopolitics typically supports safe-haven demand, it simultaneously drives oil prices higher. This dynamic intensifies pressure on gold through elevated inflation expectations and interest rate implications.
Since the start of the year, gold has remained in positive territory by approximately 12%. However, momentum has diminished as expectations for substantial rate cuts have receded, prompting some investors to lock in profits to meet margin requirements on other assets.
Technical Analysis
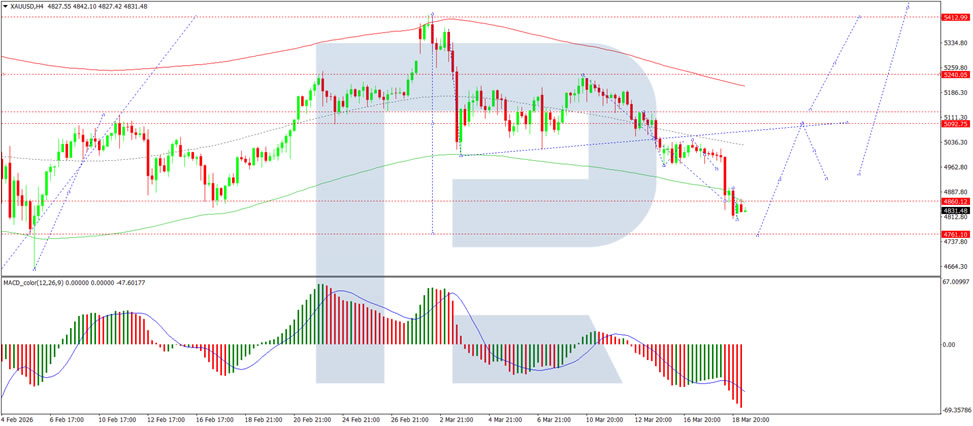
On the H4 XAU/USD chart, the market is forming a consolidation range around 4,858 USD. An upside breakout could pave the way for a correction towards 5,090 USD, while a downside breakout could extend the wave downward to 4,761 USD. The MACD indicator confirms the current momentum, with its signal line below the centre line and pointing strictly downwards.
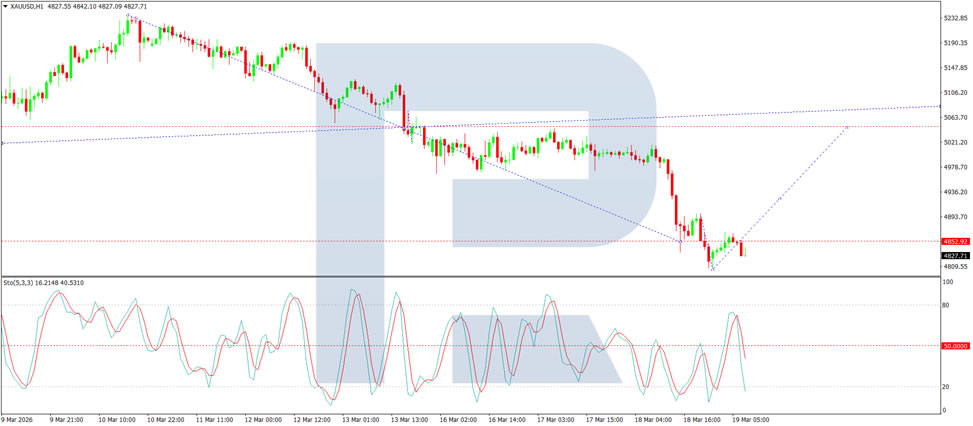
On the H1 chart, the market broke below the 5,035 USD level and completed a wave down to 4,852 USD. Looking ahead, a corrective growth wave towards 5,044 USD is possible, followed by further downside to 4,761 USD. The Stochastic oscillator supports this scenario, with its signal line remaining above 50 and showing potential to rise towards 80 before turning lower.
Conclusion
Gold’s six-day losing streak reflects the market’s recalibration to a more hawkish Federal Reserve, with only one rate cut now priced for 2026. While escalating Middle East tensions, including strikes on Qatari LNG infrastructure, typically boost safe-haven demand, the simultaneous impact on oil prices and inflation expectations is proving the stronger force, keeping pressure on the non-yielding asset. Technical indicators suggest further downside potential towards 4,761 USD, though oversold conditions could trigger temporary bounces. The metal’s year-to-date gains have been trimmed as investors adjust positions ahead of what now appears to be a prolonged period of higher rates.
Disclaimer
Any forecasts contained herein are based on the author’s particular opinion. This analysis may not be treated as trading advice. RoboForex bears no responsibility for trading results based on trading recommendations and reviews contained herein.


