
Key takeaways
- Bearish trend intact despite rebound: Gold (XAU/USD) plunged 15% to a 4-month low before a 12% rebound, but the bounce is likely a dead cat bounce, with another bearish leg expected.
- Stagflation & oil strength driving downside risk: Rising WTI crude oil supports a stagflation backdrop, increasing interest rate pressures, and the opportunity cost of holding gold, reinforcing a negative correlation and downside bias.
- Key technical levels signal further weakness: Breach below $4,440 on Gold (XAU/USD) may trigger a move toward $4,099 and lower, while only a break above $4,620 would invalidate the bearish outlook.
Since 19 March, Gold (XAU/USD) has staged the expected bearish impulsive down move sequence and plummeted by 15% to print a 4-month low of $4,099 on Monday, 23 March 2026, supported by the “stagflation fear” macro factor.
Thereafter, the previous yellow metal staged a rebound of 12% to hit an intraday high of $4,603 on the backdrop of “TACO” optimism that the US White House Administration is looking to end the month-long US-Iran war, in turn, allowing passage to reopen in the Strait of Hormuz, the global oil flow choke point.
Right now, intermarket and technical analyses are pointing to another leg of bearish impulsive down move for Gold (XAU/USD), likely the end of the 12% corrective rebound, aka dead cat bounce from Monday’s low.
A firmer WTI crude oil supports further weakness in Gold (XAU/USD)
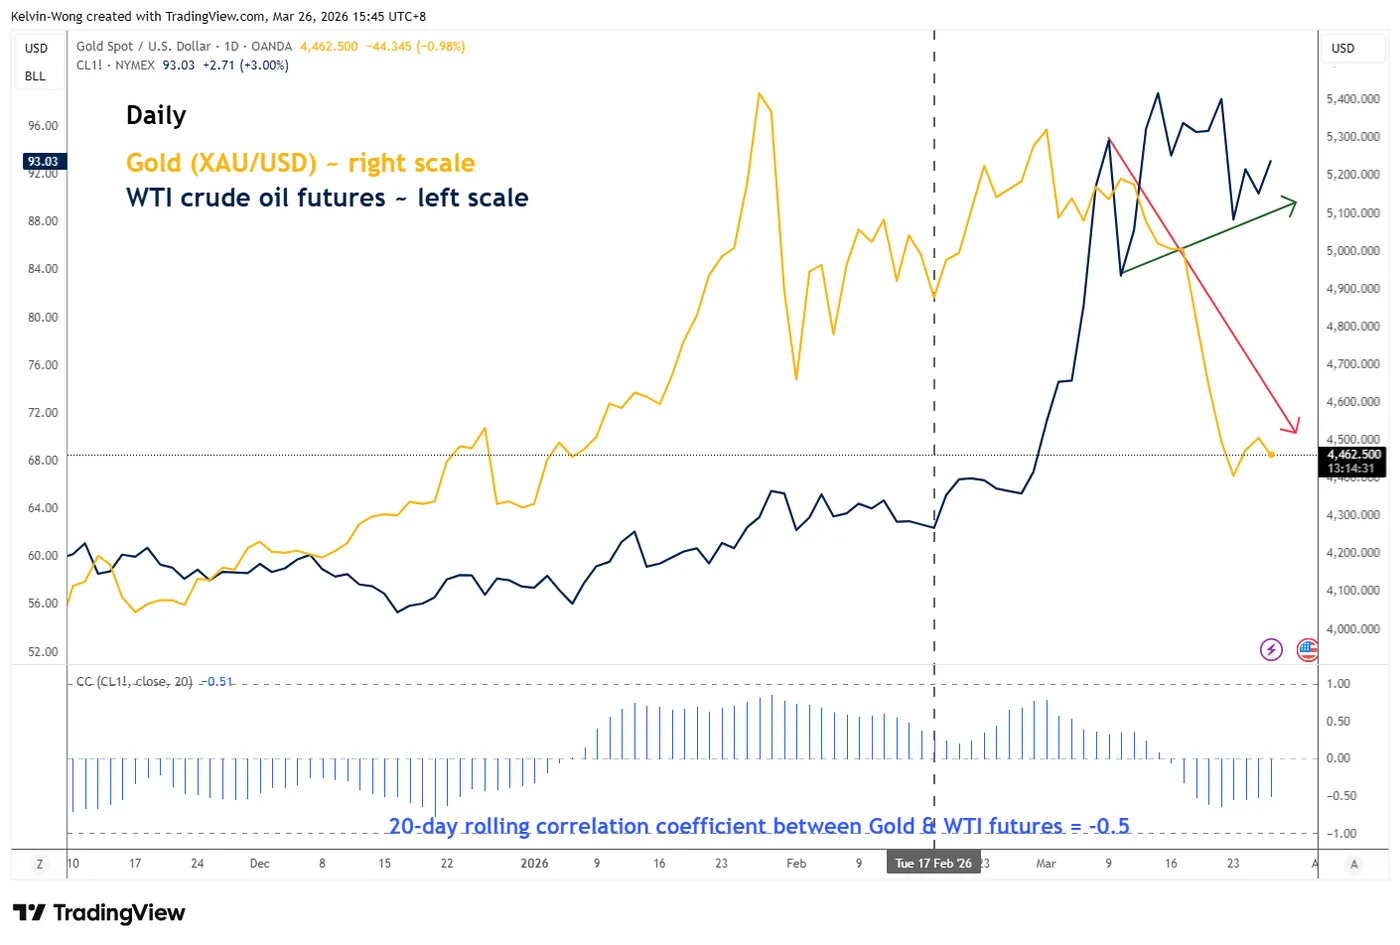
Fig. 1: Gold (XAU/USD) & WTI crude oil futures indirect correlation as of 26 Mar 2026 (Source: TradingView)
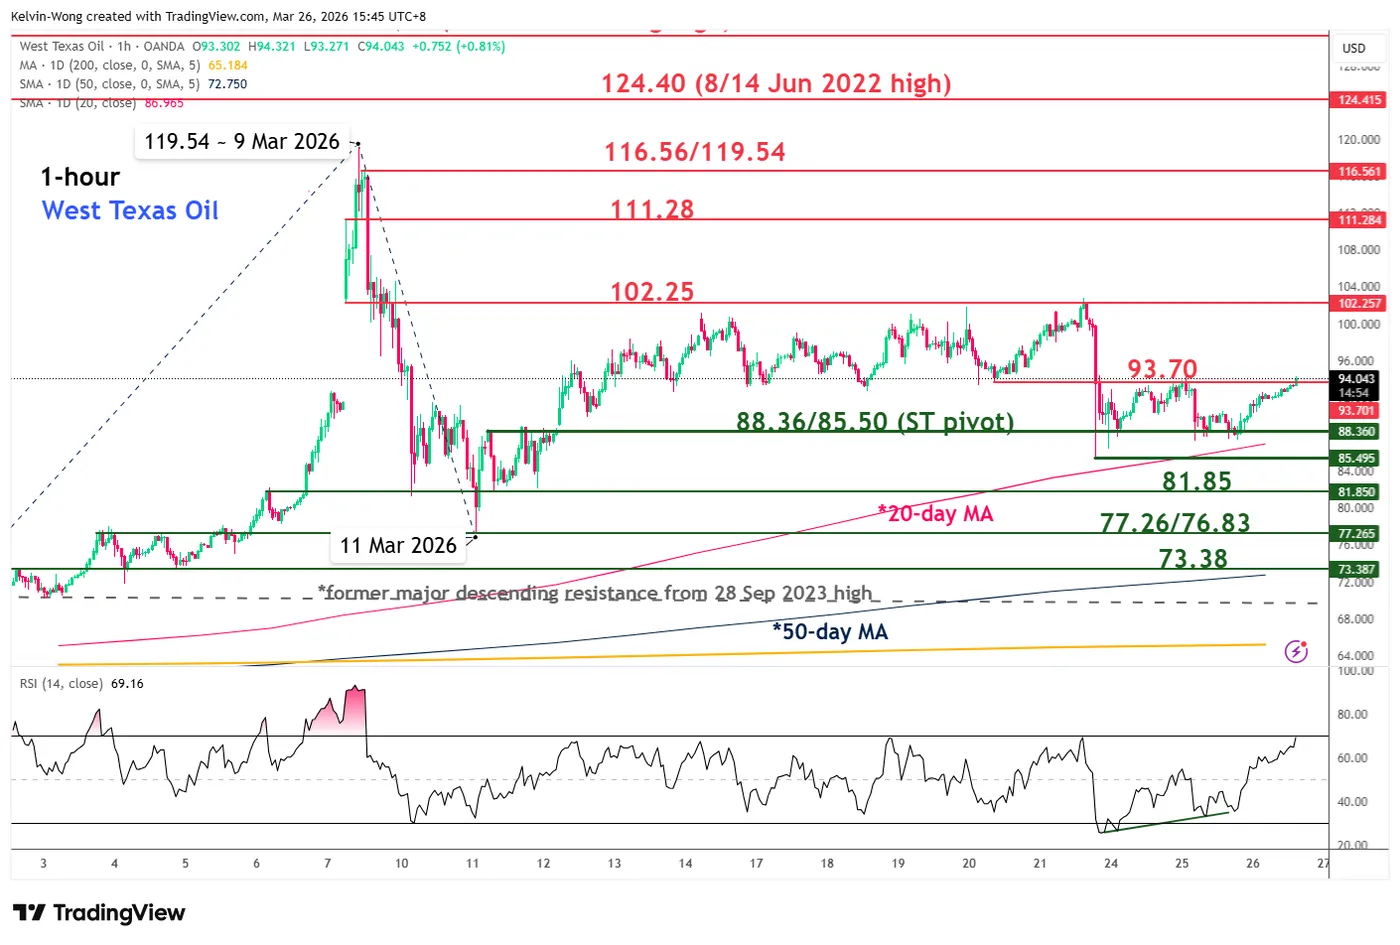
Fig. 2: West Texas Oil CFD minor trend as of 26 Mar 2026 (Source: TradingView)
The macro connection between WTI crude oil and Gold is stagflation risk.
Higher oil prices via supply side shock (closure of the Strait of Hormuz leads to a lesser oil supply globally, in turn, also creating a second-order effect of lower aggregate demand as input costs of finalized goods and services get more expensive).
Hence, stagflation is a deadly combination of higher prices and lower economic growth prospects in later stages. A challenging environment for central bankers as they cannot easily implement expansionary monetary policies to counter and anticipate the second-order demand destruction in a stagflation environment.
Therefore, central banks are likely to adopt a “wait and see” approach, and some “inflation-fighting” central banks may turn cautiously hawkish and start to implement an interest rate hike cycle.
Gold, being a non-interest income-bearing asset, will incur higher opportunity costs as interest rates rise globally, in turn, triggering a negative feedback loop into the price actions of Gold.
Since 17 February 2026, the movement of WTI crude oil futures has an indirect correlation with Gold (XAU/USD), and its 20-day rolling correlation coefficient stands at -0.5 at this time of writing (see Fig.1).
The recent pull-back in the West Texas Oil CFD (a proxy of the WTI crude oil futures) due to “TACO jaw bowing” has managed to find support at its rising 20-day moving average.
West Texas Oil CFD’s medium-term uptrend phase remains intact, a clearance above $93.70 key near-term resistance may see a further push up to retest the $102.25 intermediate range resistance in the first step (see Fig. 2).
Gold (XAU/USD) – End of corrective rebound, start of new bearish leg
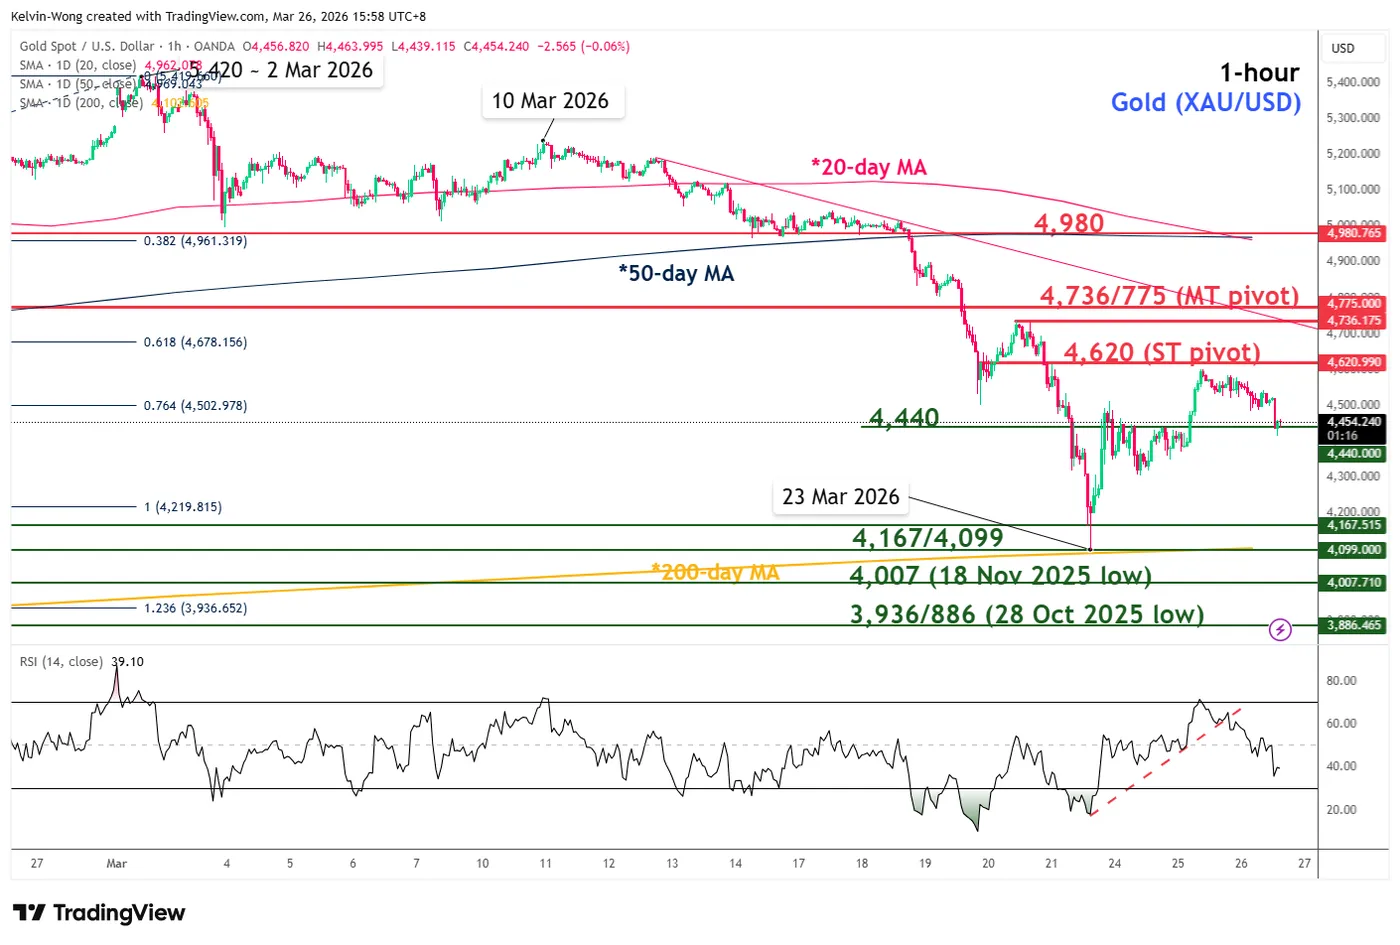
Fig. 3: Gold (XAU/USD) minor trend as of 26 Mar 2026 (Source: TradingView)
Watch the $4,620 key short-term pivotal resistance on Gold (XAU/USD). A break below the $4,440 key near-term support (downside trigger level) may set off another bearish impulsive down move sequence to retest $4,167/4,099 before exposing the next supports at $4,007 and $3,936/3,886 (also a Fibonacci extension) (see Fig. 3).
On the other hand, a clearance and an hourly close above $4,620 invalidate the bearish scenario for an extension of the corrective rebound towards the $4,737/4,775 key medium-term pivotal resistance zone.
Key elements to support the bearish bias on Gold (XAU/USD)
- The hourly RSI momentum indicator has staged a bearish breakdown below its key ascending trendline support.
- The recent 12% rebound seen in Gold (XAU/USD) from its 23 March 2026 low has stalled close to the 50% Fibonacci retracement of the prior impulsive down move from the 10 March 2025 high to 23 March 206 low.


 has staged the expected bearish impulsive down move sequence and plummeted by 15% to print a 4-month low of $4,099 on Monday, 23 March 2026, supported by the “stagflation fear” macro factor.)