
Key takeaways
- Risk-off sentiment returns: Trump’s hawkish rhetoric on Iran dashed de-escalation hopes, reigniting stagflation concerns and triggering a broad risk-off move, equities, AUD/USD, and Asian markets fell, while oil surged and the US dollar strengthened.
- Equities and risk assets remain under pressure: S&P 500, Nasdaq 100, and AUD/USD show renewed bearish momentum after failed rebounds, with technical setups pointing to further downside unless key resistance levels are reclaimed.
- Divergence in commodities: WTI crude oil remains supported in a bullish uptrend above key levels, while gold’s recent rally appears corrective, with risks of a bearish breakdown as momentum weakens.
US President Trump’s evening prime-time speech on Wednesday, 1 April at 9.00 p.m. Washington time does not offer any new information to global financial markets. A quick recap: Trump highlighted earlier on Tuesday, March 31, that the US-Iran war will “end soon” within the next two to three weeks.
Interestingly, Trump has indirectly issued a more “hawkish rhetoric” towards the Iranian leadership in his prime-time national address, stating that the US will hit Iran “extremely hard” in the next two to three weeks, and added that the US will also strike Iran’s electric plants if there is no deal.
Overall, there is no clear indication of a forthcoming “de-escalation” from Trump, which in turn brings the stagflation risk narrative back to the forefront again.
How do the markets react? Risk-off mode at this time of writing.
- WTI crude oil +5.8% at around $104 per barrel
- Brent crude oil +6.4% at around $106 per barrel
- US Dollar Index +0.4%
- AUD/USD -0.6%
- Gold (XAU/USD) -1.7%
- S&P 500 & Nasdaq 100 E-mini futures -1.1% & -1.3%
- Japan’s Nikkei 225 -2.2%
- Hong Kong’s Hang Seng Index -1.1%
- China’s CSI 300 -0.7%
- South Korea’s KOSPI 200 -4.7%
- Singapore’s Straits Times Index -0.7%
We have highlighted in our earlier detailed report that the prior three-day rebound seen on the three major benchmark US stock indices, S&P 500, Nasdaq 100, and Dow Jones Industrial Average are likely a mean reversion rebound sequence (dead cat bounces) within their respective medium-term downtrend phases.
Let’s focus now on the short-term trajectory (1 to 3 days) on the S&P 500, Nasdaq 100, AUD/USD, Gold (XAU/USD), and WTI crude oil from a technical analysis perspective.
S&P 500 – Bearish reaction at descending channel resistance with bearish momentum
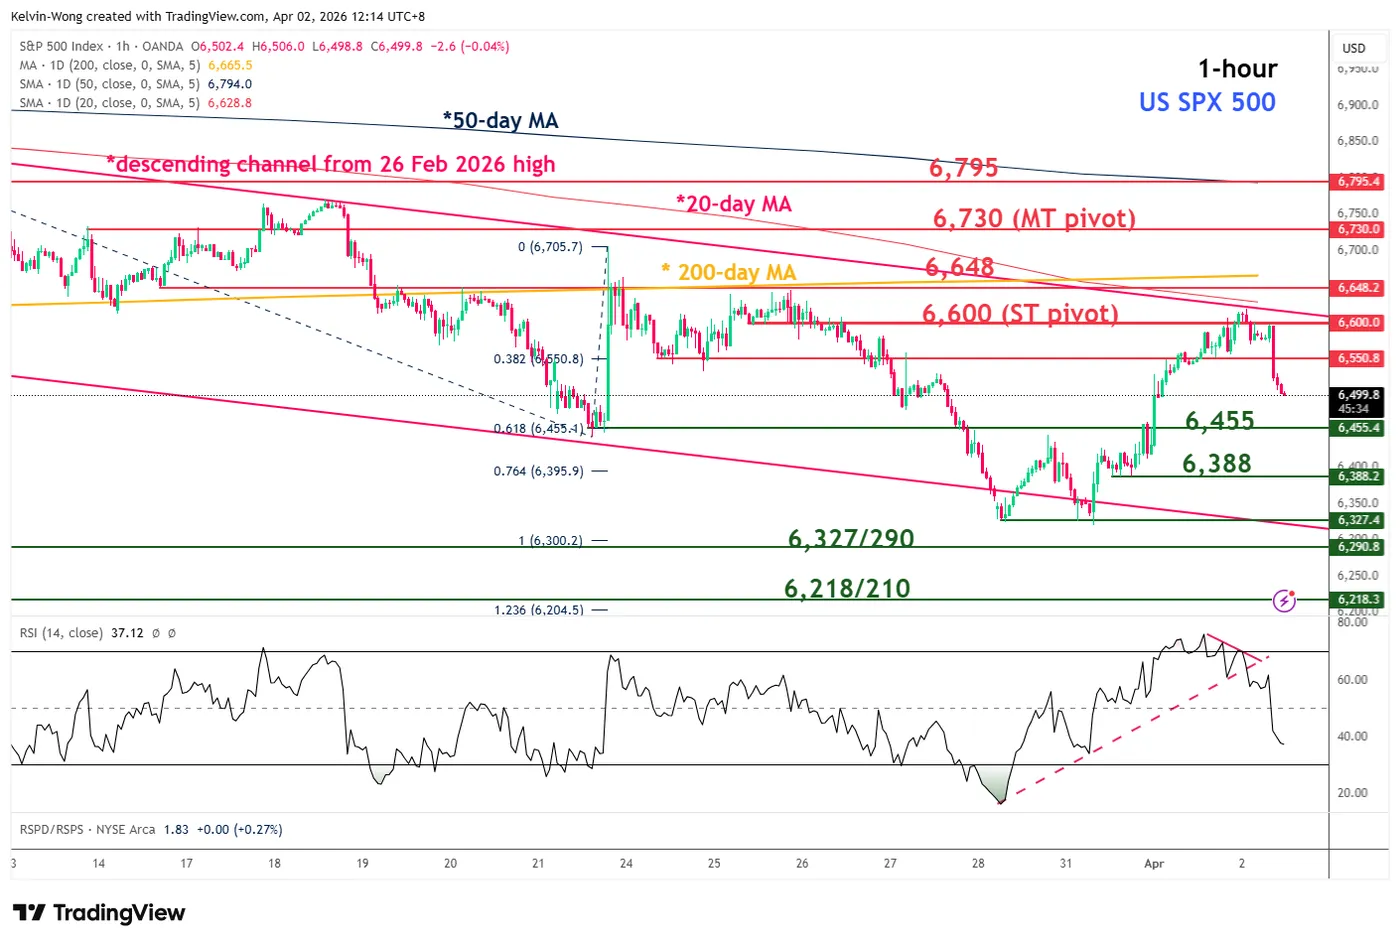
Fig. 1: US S&P 500 CFD index minor trend as of 2 Apr 2026 (Source: TradingView)
The price actions of the US S&P 500 CFD index (a proxy of the S&P 500 E-mini futures) have staged a bearish reaction right after a retest on its 20-day moving average and upper boundary of a descending channel in place since 26 February 2026 high (see Fig. 1).
In addition, the hourly RSI momentum indicator has staged a bearish breakdown below its former ascending trendline support after it flashed a bearish divergence condition at its overbought zone.
Watch the 6,600 key short-term pivotal resistance, and a break below 6,455 near-term support is likely to trigger another potential bearish impulsive down move sequence to expose the next intermediate supports at 6,327/6,290 and 6,218/6,210.
However, a clearance above 6,600 invalidates the near-term bearish scenario for an extension of the mean reversion rebound towards 6,648/6,730 zone.
Nasdaq 100 – Bearish reaction below 20-day moving average with bearish momentum
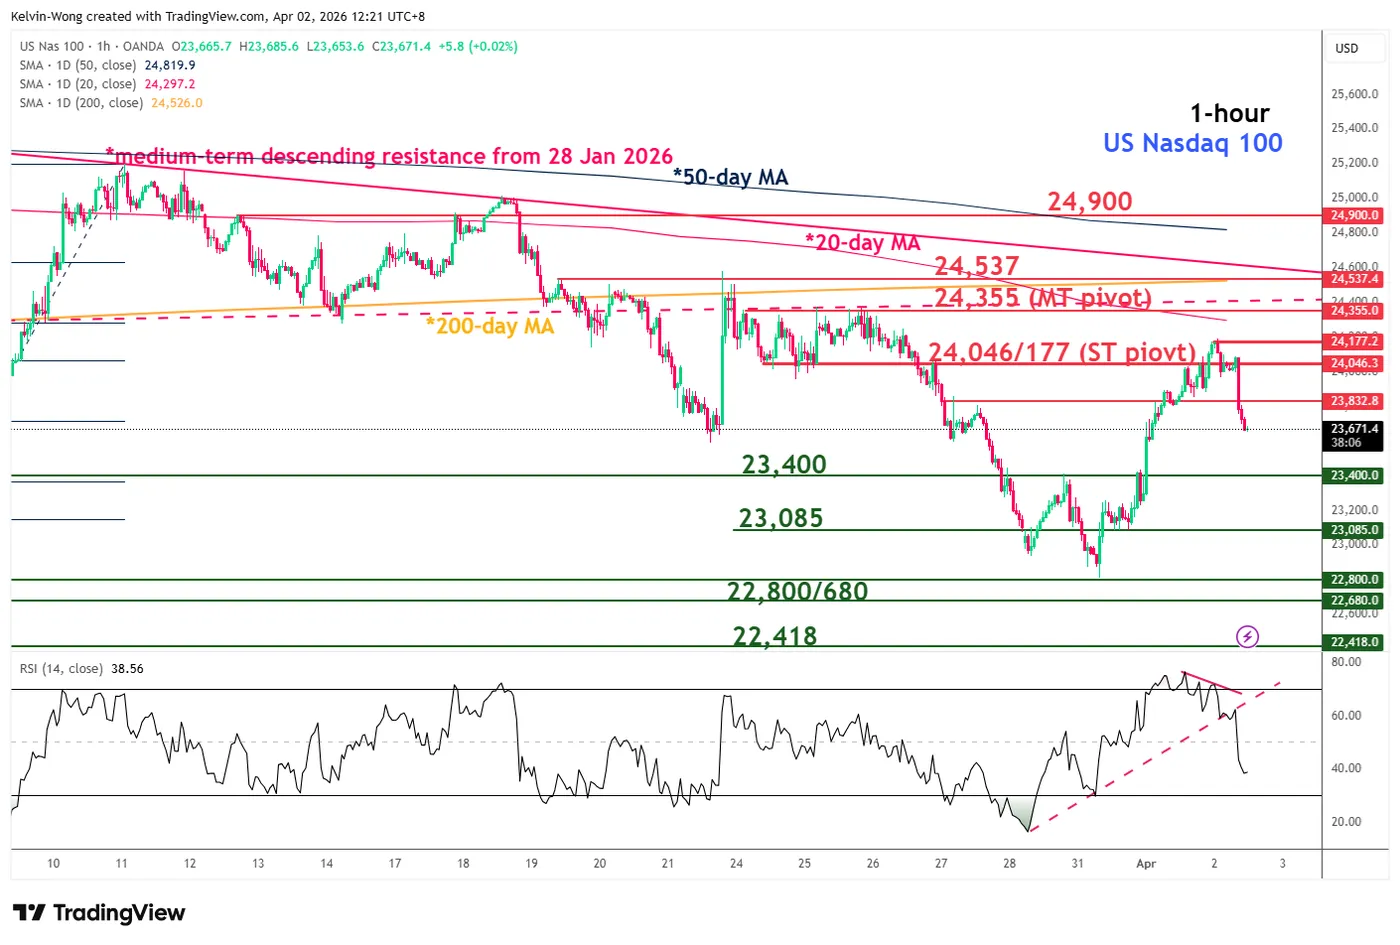
Fig. 2: US Nasdaq 100 CFD index minor trend as of 2 Apr 2026 (Source: TradingView)
The price actions of the US Nasdaq 100 CFD index (a proxy of the Nasdaq 100 E-mini futures) have staged a bearish reaction below its downward-sloping 20-day moving average, coupled with the hourly RSI momentum indicator’s bearish breakdown below its key ascending trendline support (see Fig. 2).
Watch the 24,047/24,177 key short-term pivotal resistance, and a break below 23,400 near-term support is likely to trigger another potential bearish impulsive down move sequence to expose the next intermediate supports at 23,085 and 22,800/22,680.
On the other hand, a clearance above 24,177 invalidates the near-term bearish scenario for an extension of the mean reversion rebound towards the 24,355/24,537 zone.
AUD/USD – En route towards the lower limit of the descending channel
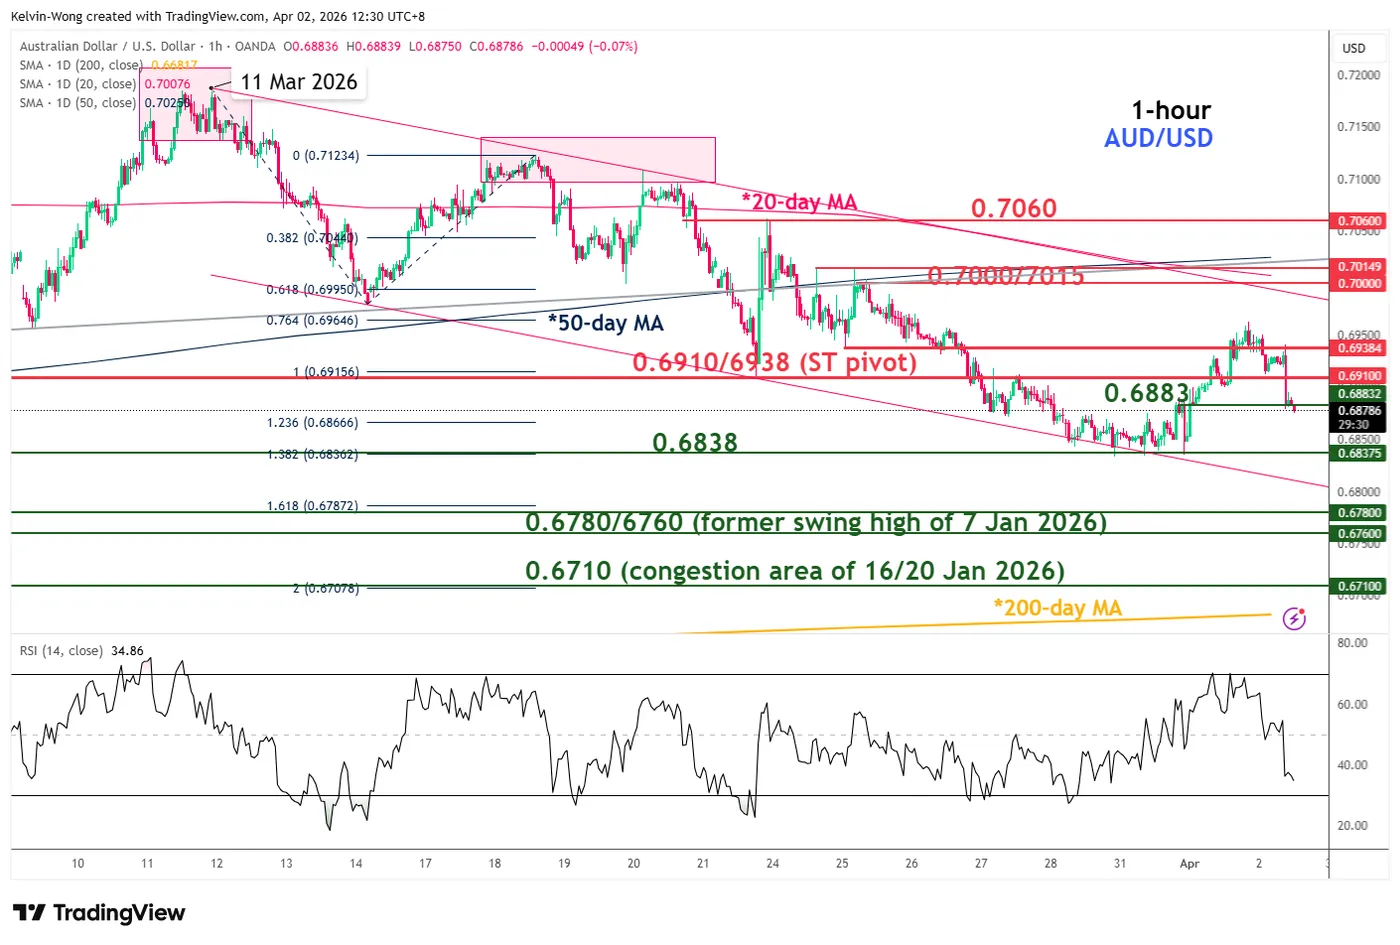
Fig. 3: AUD/USD minor trend as of 2 Apr 2026 (Source: TradingView)
The minor corrective mean reversion rebound seen on the AUD/USD from its swing low of 0.6838 printed on Monday, 30 March 2026, is likely to be over (see Fig. 3).
Watch the 0.6910/0.6938 key short-term pivotal resistance, and a break below 0.6838 is likely to trigger a potential fresh bearish impulsive down move sequence to expose the next intermediate supports at 0.6780/0.6760 and 0.6710 (also close to the key 200-day moving average).
However, a clearance above 0.6938 invalidates the near-term bearish scenario for an extension of the mean reversion rebound towards the next intermediate resistance at 0.7000/0.7015 (also the 50-day moving average).
Gold (XAU/USD) – At risk of a “bearish flag” breakdown below $4,775 key resistance
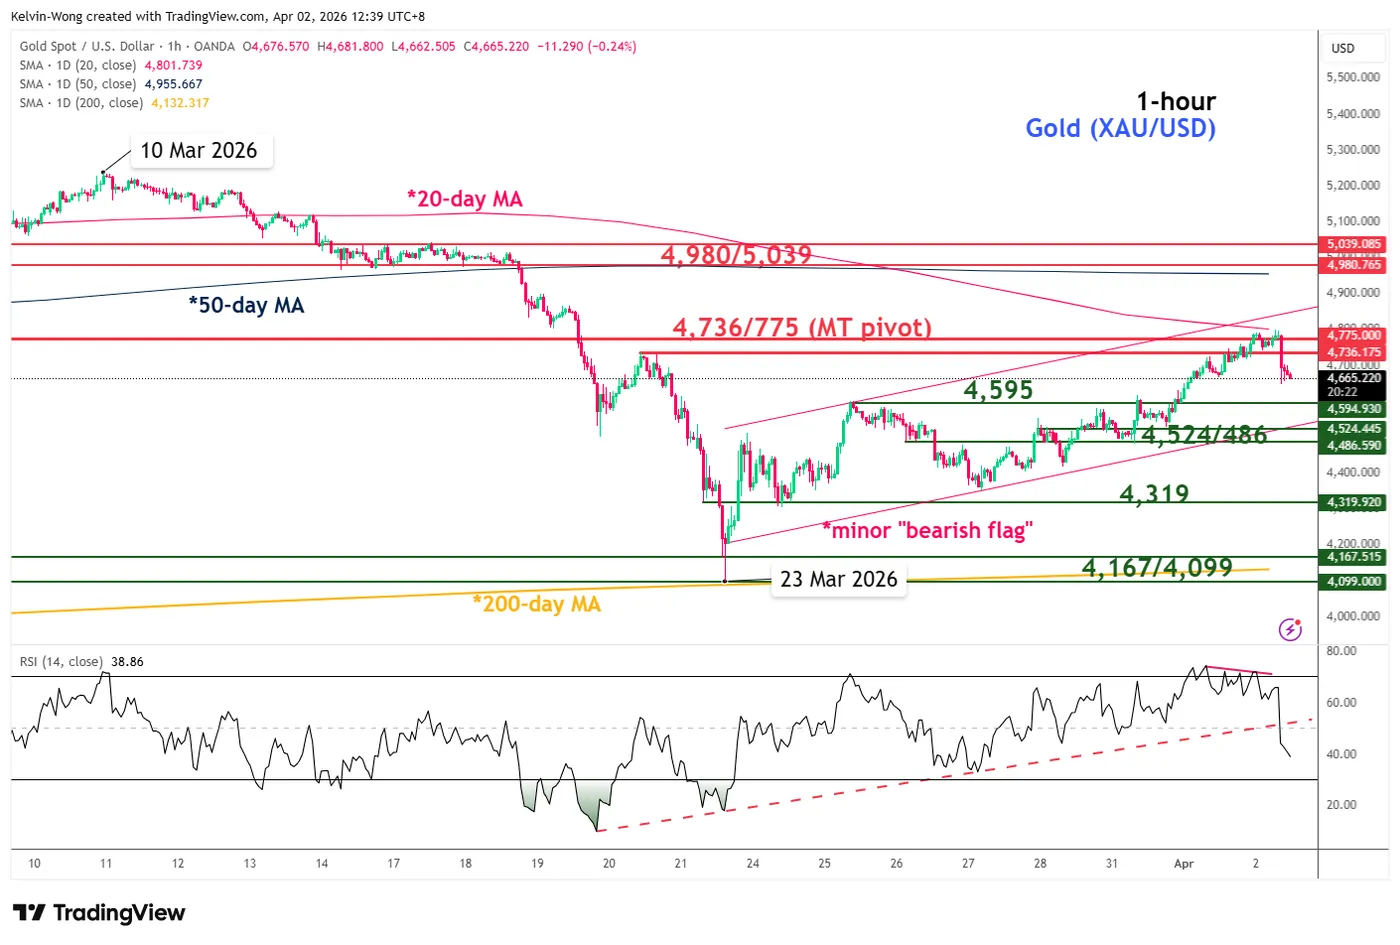
Fig. 4: Gold (XAU/USD) minor trend as of 2 Apr 2026 (Source: TradingView)
The recent seven-day rally (high to low) of 17% from the 23 March 2026 low seen in Gold (XAU/USD) is likely to be a corrective mean reversion rebound in the form of a “bearish flag” within its medium-term downtrend phase (see Fig. 4).
The bullish momentum of the 7-day rally is getting exhausted. The hourly RSI momentum indicator has just staged a bearish breakdown below its key ascending trendline support after a prior bearish divergence condition at its overbought zone
Watch the $4,775 key medium-term pivotal resistance, and a break below $4,524/4,486 support (the lower boundary of the “bearish flag”) is likely to trigger another potential minor bearish impulsive down move sequence in the first step to expose the next intermediate supports at $4,319 and $4,167/4,099 (also the key 200-day moving average).
On the flip side, a clearance above $4,775 invalidates the near-term bearish scenario for an extension of the mean reversion rebound towards the next intermediate resistance at $4,980/5,039 (also the 50-day moving average).
WTI crude oil – Bulls find support above 20-day moving average, traded back above $102.25
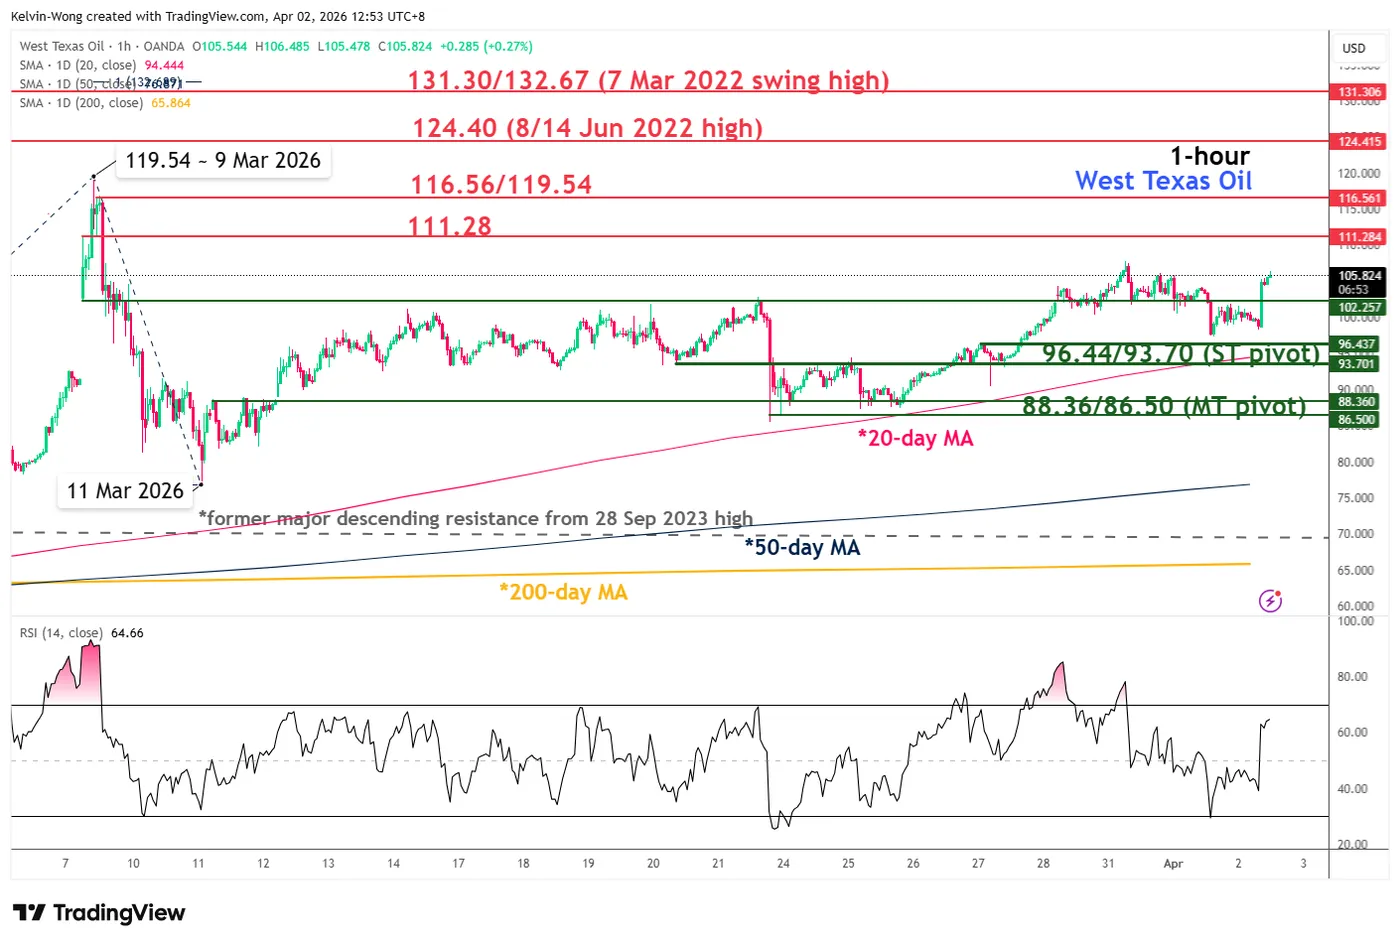
Fig. 5: West Texas oil CFD minor trend as of 2 Apr 2026 (Source: TradingView)
The intraday sell-off seen on Wednesday, 1 April 2026, for West Texas oil CFD (a proxy of the WTI crude oil futures) has been erased as its price actions trade back above $102.25 (see Fig. 5).
Watch the $96.44/93.70 key short-term pivotal support (close to the 20-day moving average) to maintain a potential fresh minor impulsive up move sequence towards $116.56/119.54 in the first step within its medium-term uptrend phase.
A clearance above $116.56/119.54 opens scope for the next intermediate resistance to come in at $124.40 follow by the major resistance of $131.30/132.67, seen during the onset of the Russia-Ukraine war.
On the other hand, a break below $93.70 negates the bullish tone for a slide towards the medium-term pivotal support zone of $88.36/86.50.


