
- Oil attempted to correct after the latest US-Iran ceasefire announcement
- However, the truce is very fragile and with headlines going back and forth, commodity traders are stuck in the mud
- Exploring an in-depth Technical Analysis of WTI Crude Oil
Traders were just celebrating the latest 2-week US–Iran ceasefire news, but it now seems that Markets got ahead of themselves.
The initial reaction was one of a classic risk unwind – WTI Crude Oil gapped sharply lower from around $118 to $92 as risk premium evaporated almost instantly on the announcement. For a brief moment, it looked like the geopolitical overhang that had fueled oil’s explosive rally was finally unwinding.
But that relief didn’t last.
Since the gap lower, prices have been grinding steadily higher again, now hovering back near the key $100 level — a sign that traders are reassessing just how fragile this truce really is.
Headlines over the past 24 hours have painted a highly uncertain picture:
Iranian officials have stressed that any meaningful peace agreement must extend beyond bilateral talks, explicitly mentioning broader regional considerations, including Lebanon, and warning that the coming hours are “critical.”
At the same time, conflicting narratives between US and Iranian sources have only confirmed that the two sides are still far from trusting each other. What is sure is that traffic in the Strait of Hormuz remains more than muted, if inexistent.
A recent Reuters report indicated 6 crossings in the last 24 hours compared to the usual 140 in the same timespan – That’s not the type of progress that Markets want to see.
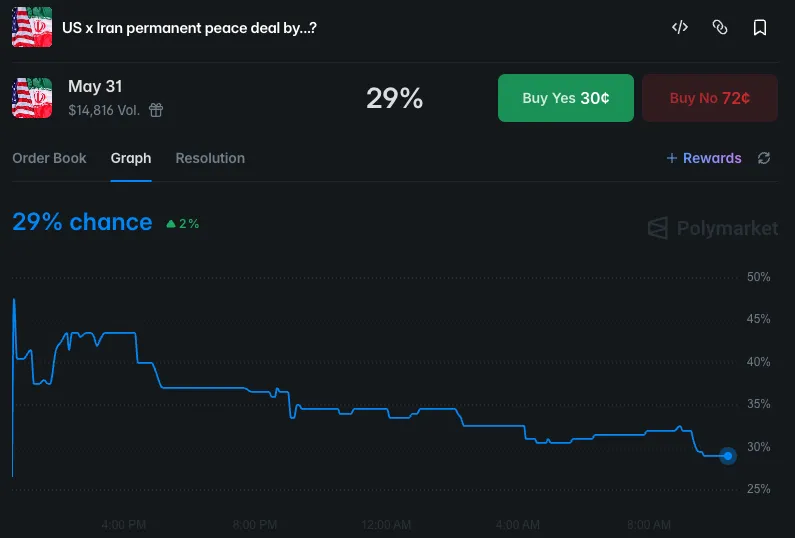
Odds for a proper US-Iran peace deal – Source: Polymarket. April 9, 2026
This kind of environment is particularly difficult for commodity pricing – Oil thrives on clarity of supply expectations, but current conditions offer anything but that. Instead, participants are stuck in a feedback loop of headline-driven volatility, where each new comment shifts sentiment without establishing a durable trend.
The result is a market caught in limbo — no longer pricing worst-case escalation, but far from confident in a sustained de-escalation.
As WTI breaks the $100 threshold yet again, the next directional move will likely depend less on technicals and more on whether diplomacy can turn from words into verifiable action. Until then, expect volatility to remain elevated and conviction to stay thin.
As the situation looks to be more clear in the coming days, let’s dive into a multi-timeframe analysis of WTI (US) Oil to determine levels of interest and put the odds in the trader’s favor to capitalize on the issue.
US Oil Multi-Timeframe Analysis
WTI 4H Chart and Technical Levels
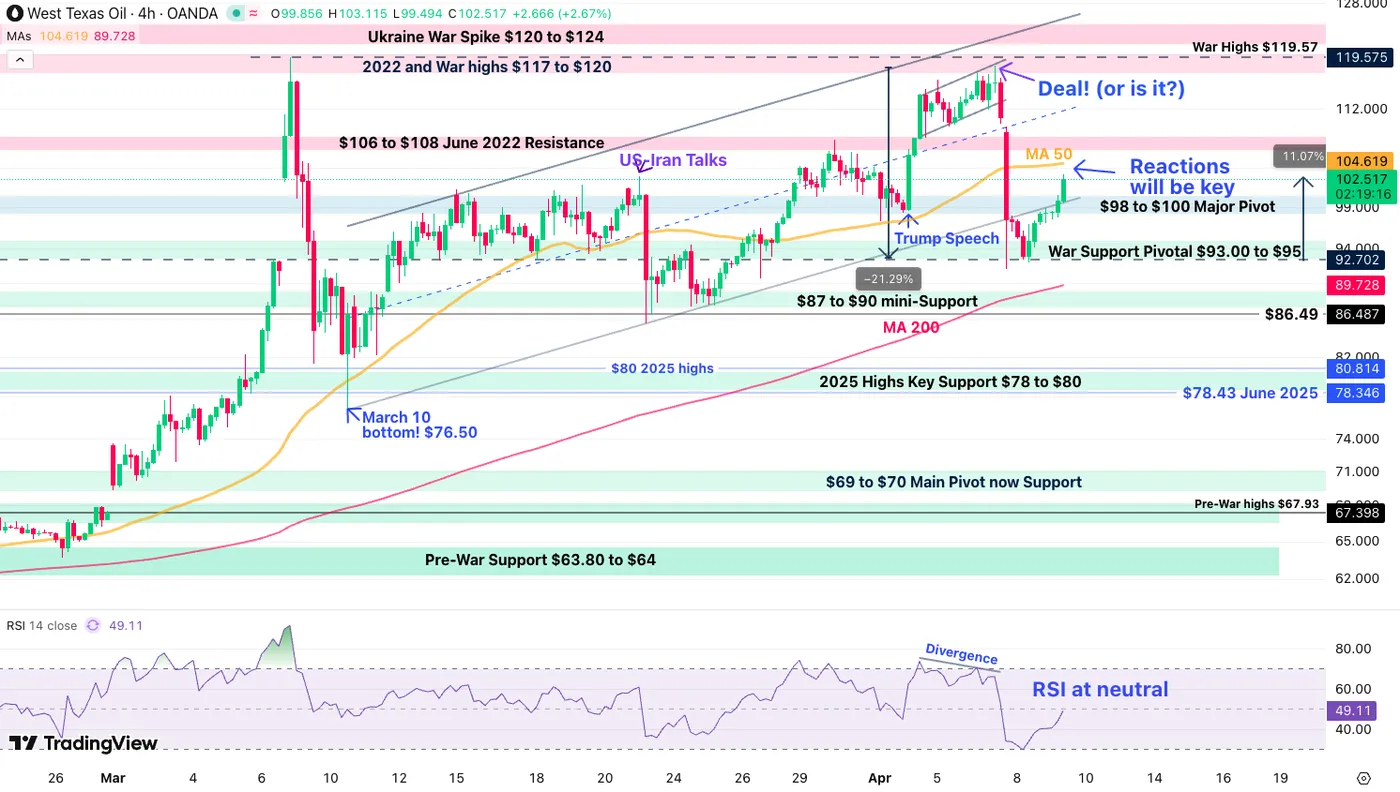
WTI Oil 4H Chart – April 9, 2026. Source: TradingView
WTI has seesawed after yesterday’s large drop to $92.70 , having already rallied by 11% since.
After touching the oversold RSI border and the bottom of the Pivotal War support (~$93), bulls have raged back into the commodity as uncertainty still looms – A very important test is now coming closer with the 4H 50-period MA ($104.62)
- Breaching back above would put the bullish panic-thesis fully back into action
- Rejecting it however would allow a more rangebound action ahead ($98 to $104 until Markets get more clarity)
- Breaking $98 again hints at a lower range ($92.70 to $98)
WTI Technical Levels:
Resistance Levels
- 4H 50-period MA / 1H 200-MA (~$104.20)
- $106 to $108 June 2022 Resistance
- $110 psychological level
- 2022 and War highs $117 to $120
Support Levels
- $98 to $100 Major Pivot
- War Support Pivotal $93.00 to $95
- $87 to $90 mini-Support (4H 200-period MA)
- 2025 Highs Key Support $78 to $80
- Pre-War Support $63.80 to $64
1H Chart and action levels
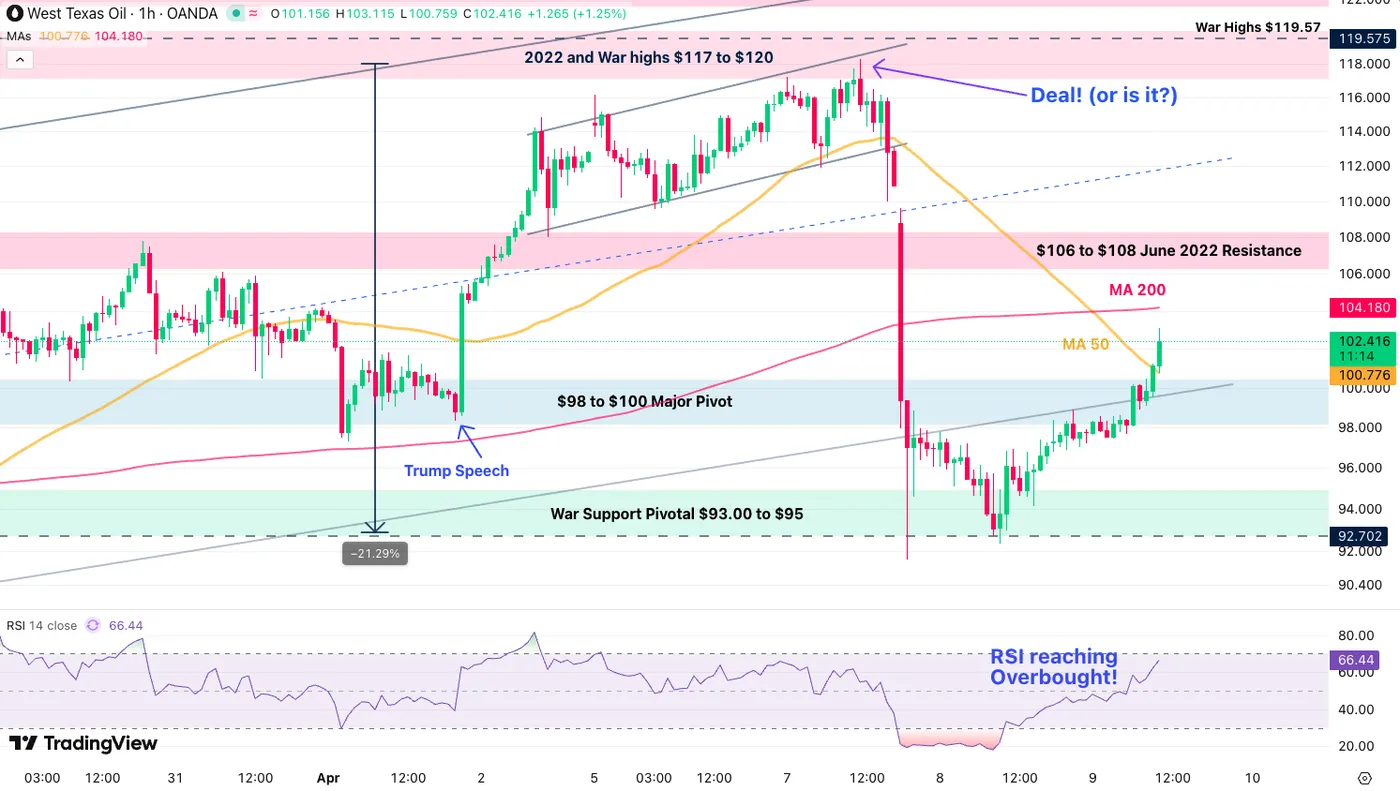
WTI Oil 1H Chart – April 9, 2026. Source: TradingView
Looking closer, WTI is once again stuck in uncertain back and forth action.
The 200-Hour MA ($104.18) will be acting as a major barometer for traders.
On the immediate action, the rebound in WTI is stalling as the 1H RSI is back to overbought.
- Traders will surely await for further news before moving on to the next trades
- Keep an eye on a potential rangebound formation from $98 to $104 as Markets await for further clarity.
Keep a close eye on the latest headlines!
Safe Trades!


