
- The Nasdaq 100 has completed a “V-shaped” recovery after the recent sellof.
- The overall trend is clearly bullish across all major timeframes, with the index currently trading above the key 25,320 resistance-turned-support level.
- The RSI is signaling overbought conditions on the Daily, H4, and M15 charts, which suggests that immediate upside momentum may be slowing and consolidation or a minor “retest” is likely.
The Nasdaq 100 has undergone a massive rally. After a period of aggressive selling that saw the index dip toward the 22,800 handle, we have seen a textbook “V-shaped” recovery.
The most notable development is the breakout from the descending channel (highlighted by the dark trendlines). This breakout was confirmed with a strong impulsive candle that cleared both the 100-day (red) and 200-day (yellow) Moving Averages (MAs).
Currently, the index is trading above the 25,320 resistance-turned-support level. The RSI on the daily is approaching overbought territory (65.5), but it still shows room for a final push toward the previous all-time highs near 26,200 before a meaningful correction is required.
Nasdaq 100 Daily Chart, April 14, 2026
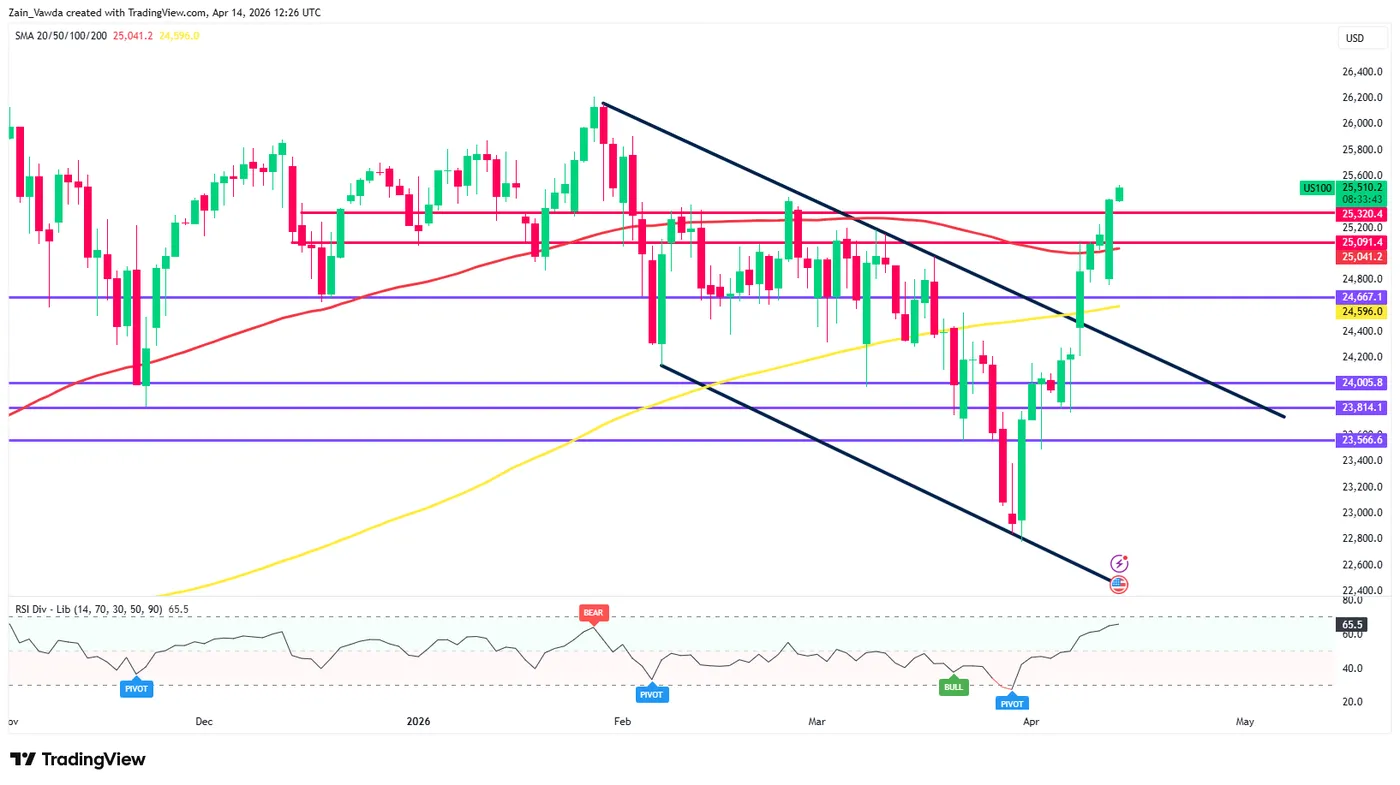
Source: TradingView (click to enlarge)
H4 and H1 Chart Analysis: Momentum and Market Structure
Moving down to the H4 and H1 timeframes, the bullish momentum is even more evident. The “Golden Cross” or proximity of the moving averages suggests that the path of least resistance remains to the upside.
H4 Perspective: The index has cleared the 25,091 level with ease. We see a series of higher highs and higher lows. The H4 RSI is currently at 74.1, indicating that while the trend is strong, we may see some intraday consolidation or a minor “retest” of the breakout zone at 25,320.
H1 Perspective: The hourly chart shows a steep ascending slope. The moving averages are perfectly fanned out in a bullish alignment. We are seeing some “Bear” divergence signals appearing on the RSI (red labels), which suggests that the immediate upside might be slowing down as we approach the US open.
Nasdaq 100 Four-Hour Chart, April 14, 2026
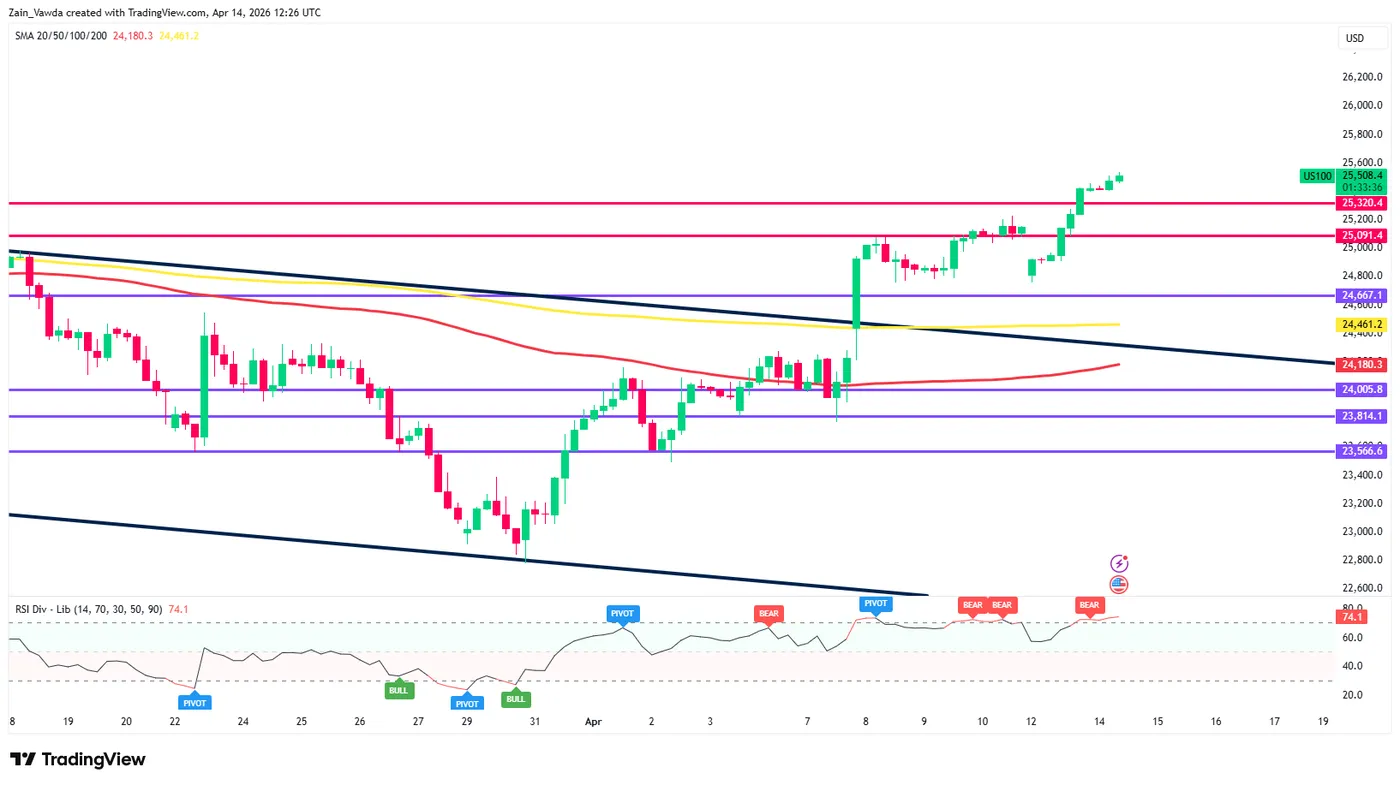
Source: TradingView (click to enlarge)
M15 Analysis: US Session Scenarios
Let us take a look at the M15 ahead of the US session. The index is currently hovering around 25,526.
The Bullish Scenario
If the US session opens with strong buying pressure, look for a sustained hold above 25,500. A break and close above the most recent intraday high (25,560) would open the door for a move toward 25,750. The bulls will be emboldened as long as the price stays above the 20-period MA (Blue line) on this timeframe.
The Bearish Scenario
The RSI is currently signaling overbought conditions (71.0) with several “Bear” pivot markers. If we see a “fake-out” at the open, a move back below 25,480 could trigger a liquidation of intraday long positions. This would likely lead to a move back toward the 25,320 support level (the red horizontal line), which acted as a major ceiling previously.
Key Levels to Watch:
- Resistance: 25,560, 25,750, 26,000
- Support: 25,320, 25,091, 24,667
Nasdaq 100 M15 Chart, April 14, 2026
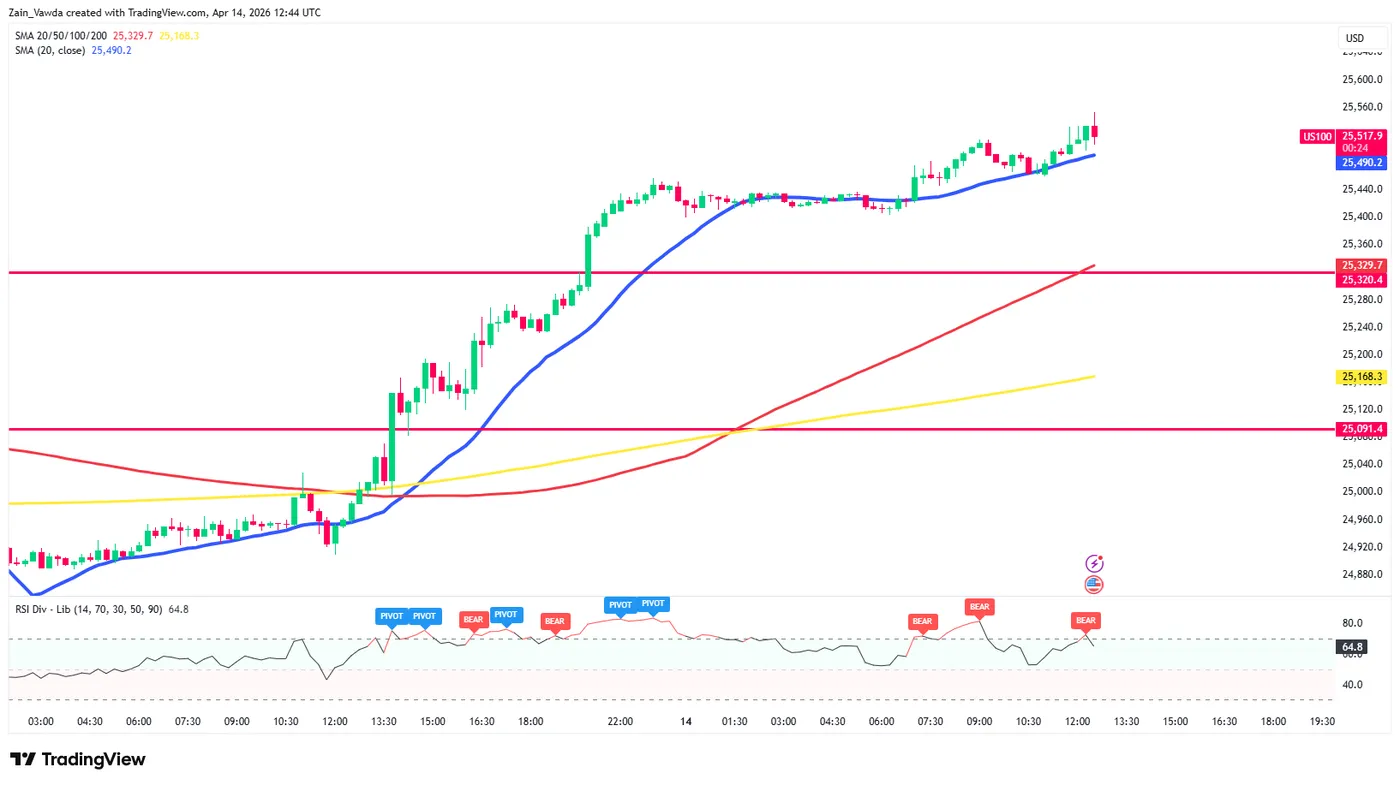
Source: TradingView (click to enlarge)
The Nasdaq 100 is in a clear bullish cycle across all major timeframes. However, given the vertical nature of the recent move and the RSI levels, the risk-to-reward ratio for new longs at current market prices is less than ideal.
Traders would be wise to look for pullbacks to the 25,320 or 25,100 zones to join the trend, rather than chasing the breakout at these elevated levels.


