
Key Highlights
- Ethereum climbed higher toward $2,450 before the bears appeared.
- A bullish trend line is forming with support at $2,100 on the daily chart of ETH/USD.
- Bitcoin price seems to be facing hurdles near $78,500 and $79,200.
- XRP failed to settle above $1.450 and $1.4650.
Ethereum Technical Analysis
Ethereum started a decent increase above the $2,350 resistance. ETH managed to climb above the $2,400 level before the bears appeared.
Looking at the daily chart, the price failed to settle above the 38.2% Fib retracement level of the downward move from the $3,399 swing high to the $1,739 low. It is now correcting some gains and testing the 100-day simple moving average (red).
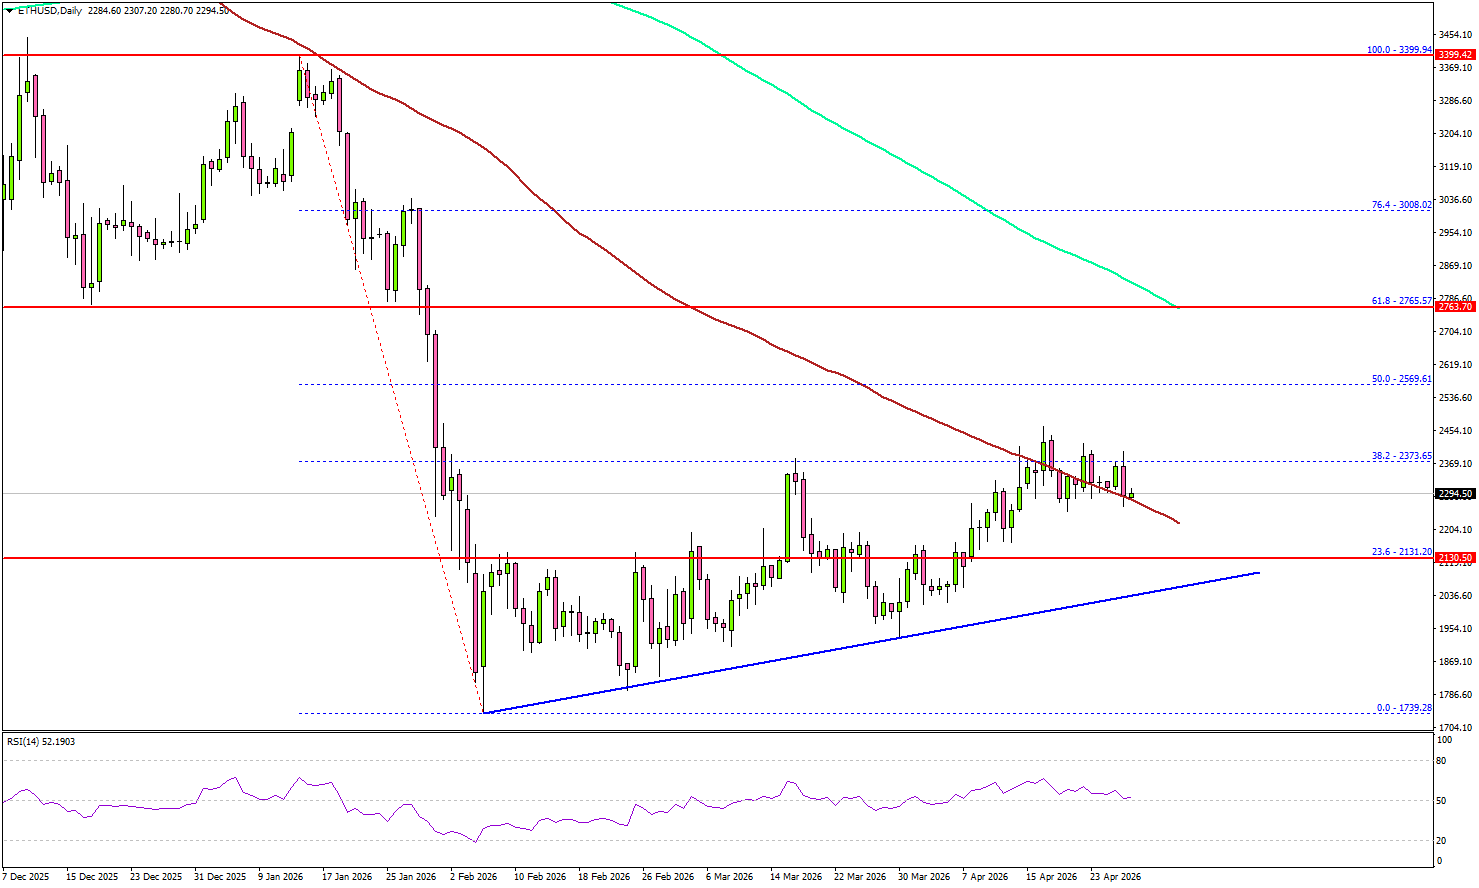
On the downside, the bulls might be active near $2,250 and $2,220. The main support is now forming near $2,100. There is also a bullish trend line forming with support at $2,100, below which the price could slide toward $1,950. Any more losses might call for a move toward $1,880.
On the upside, the bears might remain active near $2,400. The first key resistance could be near the $2,450 level. The main hurdle for bulls sits near $2,500.
A close above the $2,500 level could open doors for a larger upward movement. In the stated case, ETH could rise toward the 61.8% Fib retracement level of the downward move from the $3,399 swing high to the $1,739 low at $2,765.
Looking at Bitcoin, there was another recovery wave, but the bears remained active below the $80,000 resistance zone.
Economic Releases
- US Housing Price Index for Feb 2026 (MoM) – Forecast +0.2%, versus +0.1% previous.


