


Gold has had a rough year. After hitting an all-time high near $5,602 in January, the metal has since dropped roughly 27% from that peak, weighed down by rising Treasury yields, a firmer dollar, and cooling demand for safe-haven assets.
This week brought a fresh twist. Gold climbed back above $4,050 on Monday after President Trump signaled that peace talks with Iran would resume, following pressure from regional allies like Saudi Arabia to pause military strikes. The news pushed oil prices lower and eased inflation fears, but it also reduced some of the safe-haven demand that had been supporting gold.
Despite the sharp correction, most analysts still expect gold’s long-term uptrend to eventually reassert itself. In the near term, though, all eyes are on Friday’s US jobs report, the week’s key catalyst: a weak print could revive rate-cut expectations and give gold fresh support, while a strong one could extend the current pullback.
Technical Analysis of XAU/USD Chart
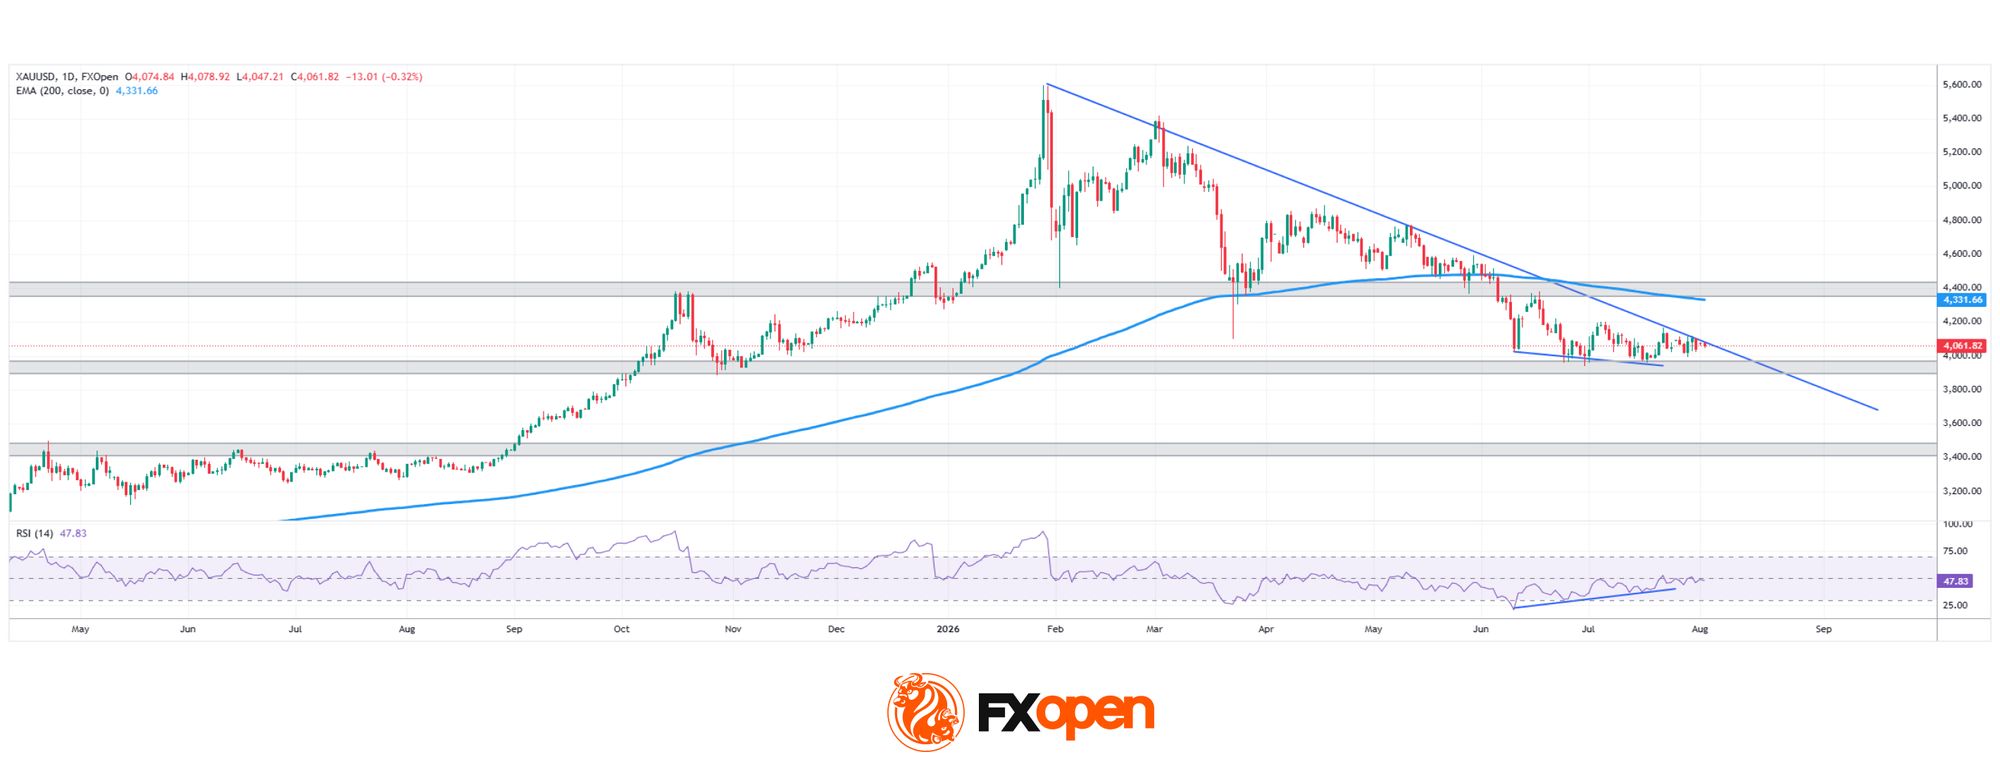
As the XAU/USD chart shows, gold remains locked in a broader downtrend since January’s record high, currently testing the descending trendline from below while holding just above the 3,900-4,000 support zone.
Bullish Scenario
Gold has already shown signs of life bouncing from the 3,900-4,000 support, and the RSI divergence lends some credibility to this reaction. Should price break decisively above the descending trendline, the next real test becomes the 4,400 resistance zone, where the 200-period EMA also converges—a level that has proven highly significant over recent months. A confirmed break above this confluence would mark a meaningful shift in gold’s broader structure.
Bearish Scenario
Should gold instead reject the trendline once again, price risks getting trapped between resistance above and support below. In that scenario, Friday’s NFP report looms as a potential catalyst: a strong print could tip the balance, breaking the 3,900-4,000 support and opening the path toward the next meaningful level, the former resistance-turned-support zone at 3,400-3,500.
With price squeezed between a stubborn trendline and a battle-tested support, and a major data release just days away, gold’s next move could finally answer the question traders have been asking since January’s peak: is the correction over, or just catching its breath?
Start trading commodity CFDs with tight spreads (additional fees may apply). Open your trading account now or learn more about trading commodity CFDs with FXOpen.
This article represents the opinion of the Companies operating under the FXOpen brand only. It is not to be construed as an offer, solicitation, or recommendation with respect to products and services provided by the Companies operating under the FXOpen brand, nor is it to be considered financial advice.





