


Key Highlights
- GBP/USD found support at 1.3180 and started a consolidation phase.
- It cleared a key bearish trend line with resistance at 1.3235 on the 4-hour chart.
- EUR/USD could extend losses unless there is a close above 1.1270.
- WTI Crude Oil prices recovered and might aim for a move to $98.00.
GBP/USD Technical Analysis
The British Pound remained firm above 1.3180 against the US Dollar. GBP/USD seems to be forming a base and might attempt a recovery wave.
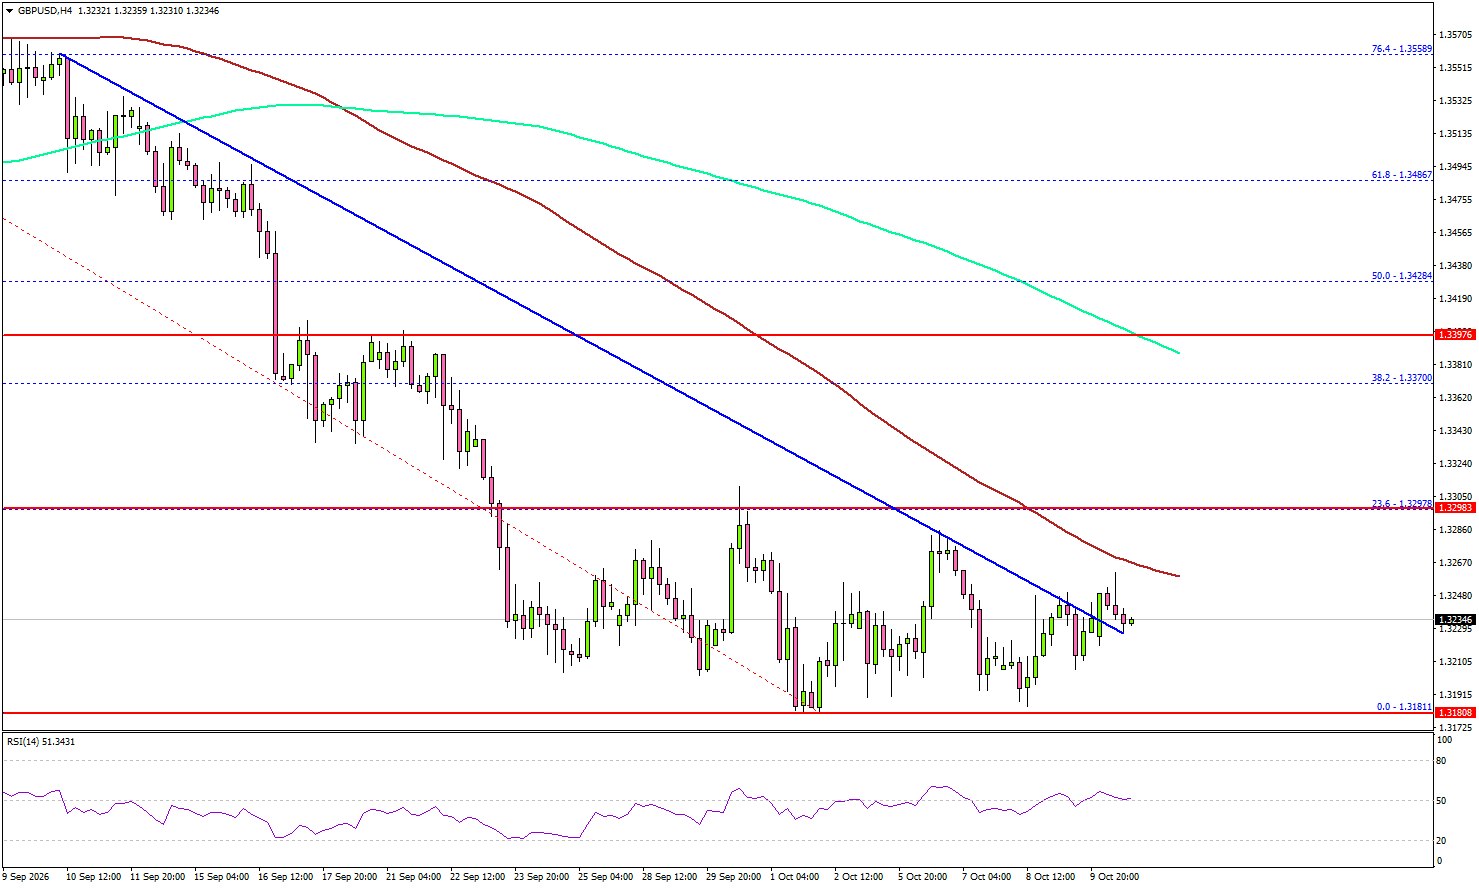
Looking at the 4-hour chart, the pair climbed above a key bearish trend line with resistance at 1.3235. Immediate resistance could be near the 100 simple moving average (red, 4-hour) at 1.3265. The first major resistance might be near the 23.6% Fib retracement level of the downward move from the 1.3675 swing high to the 1.3181 low at 1.3297.
A close above the 1.3300 pivot level could initiate a steady increase. In the stated case, the pair might rise and test the 200 simple moving average (green, 4-hour) at 1.3385.
If there is a fresh decline, the bulls might remain active near 1.3180. The first major support could be 1.3120. A close below 1.3120 might accelerate the decline. In the stated case, the pair might drop to 1.3050.
Looking at EUR/USD, the pair seems to be struggling to recover losses and might continue to move down in the near term.
Upcoming Key Economic Events:
- US Existing Home Sales for Sep 2026 (MoM) – Forecast -1.1%, versus -2.0% previous.
- US ADP Employment Change 4-week average.





