


In technical market analysis, tracking Elliott Wave structures step-by-step allows traders to stay aligned with the primary trend direction while managing risk effectively. Today, we review a recent forecast for Silver ($XAGUSD), comparing our 4-hour forecast from late September 2026 against the price action through mid-October 2026.
The Forecast: 09.24.2026
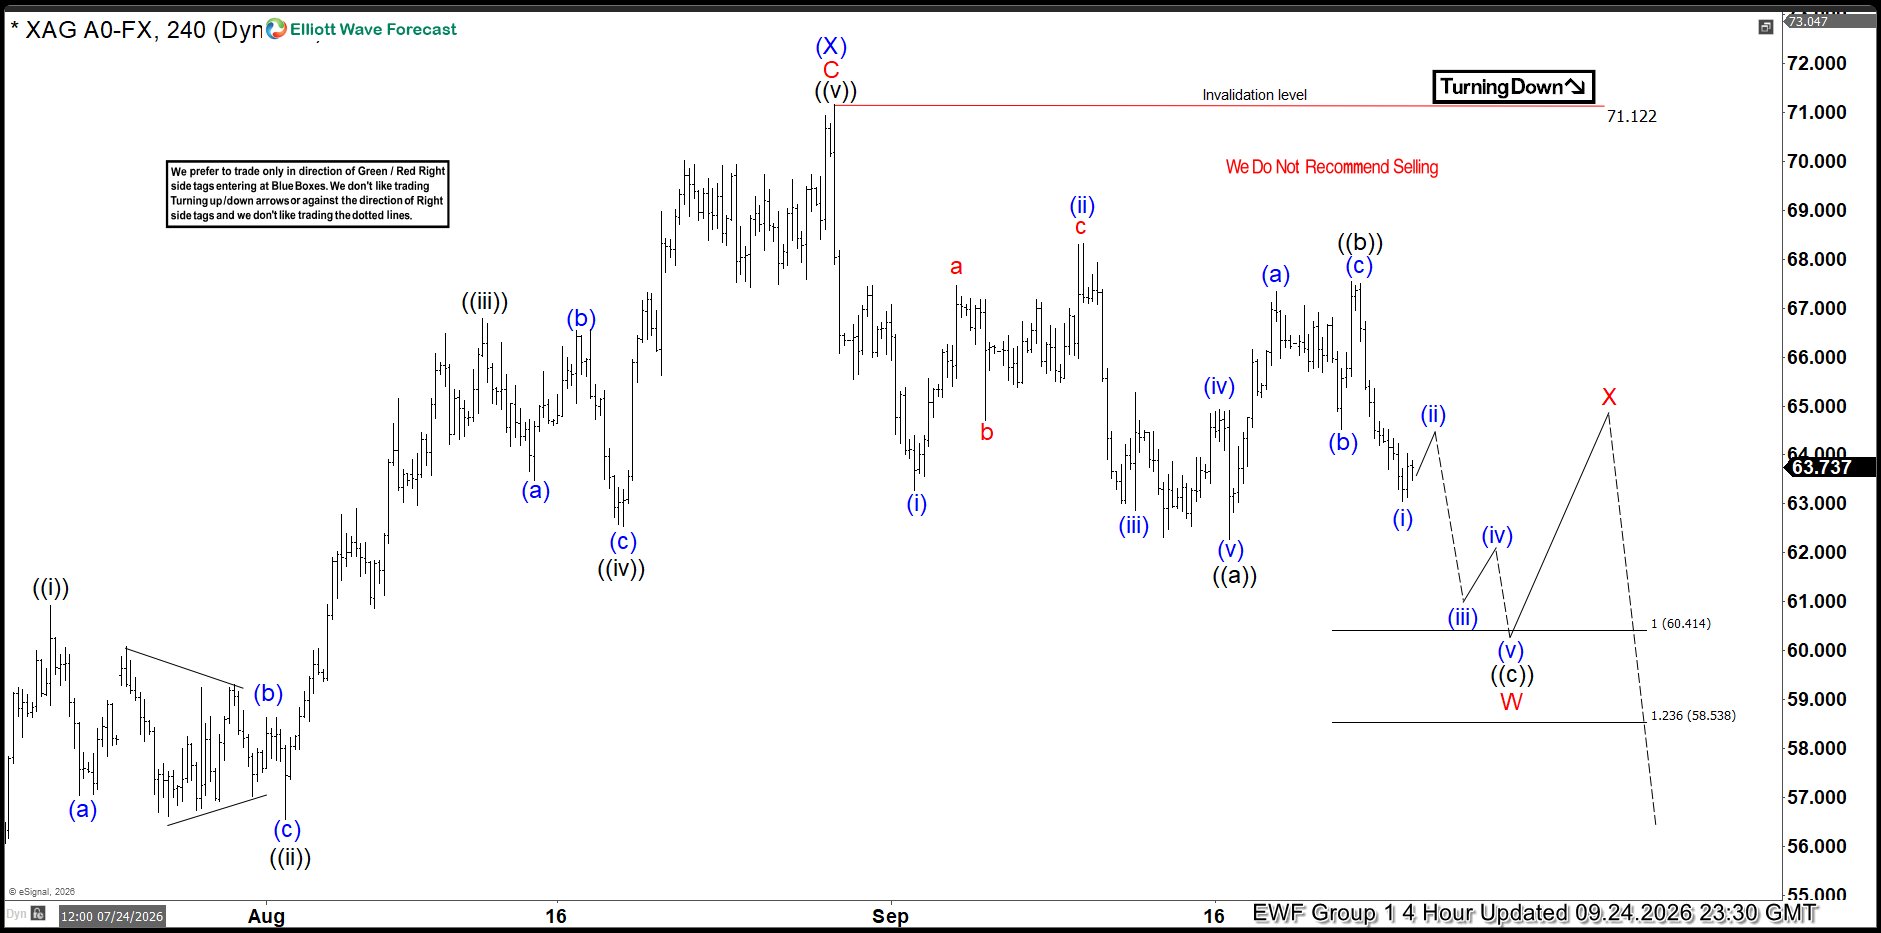
In our 09.24.2026 4-hour update, Silver was trading near 63.73 after completing a peak at the major wave (X). At the time, the Elliott Wave structure favored a bearish outlook while remaining below the key invalidation level at 71.122. The forecast called for the completion of the remaining sub-waves (iii), (iv), and (v) of ((c)), which were expected to drive price lower into the 60.414 – 58.538 target zone and complete the larger wave W. From there, a corrective wave X bounce was anticipated before Silver resumed the broader bearish sequence and continued lower. See chart below.
The Outcome: 10.14.2026
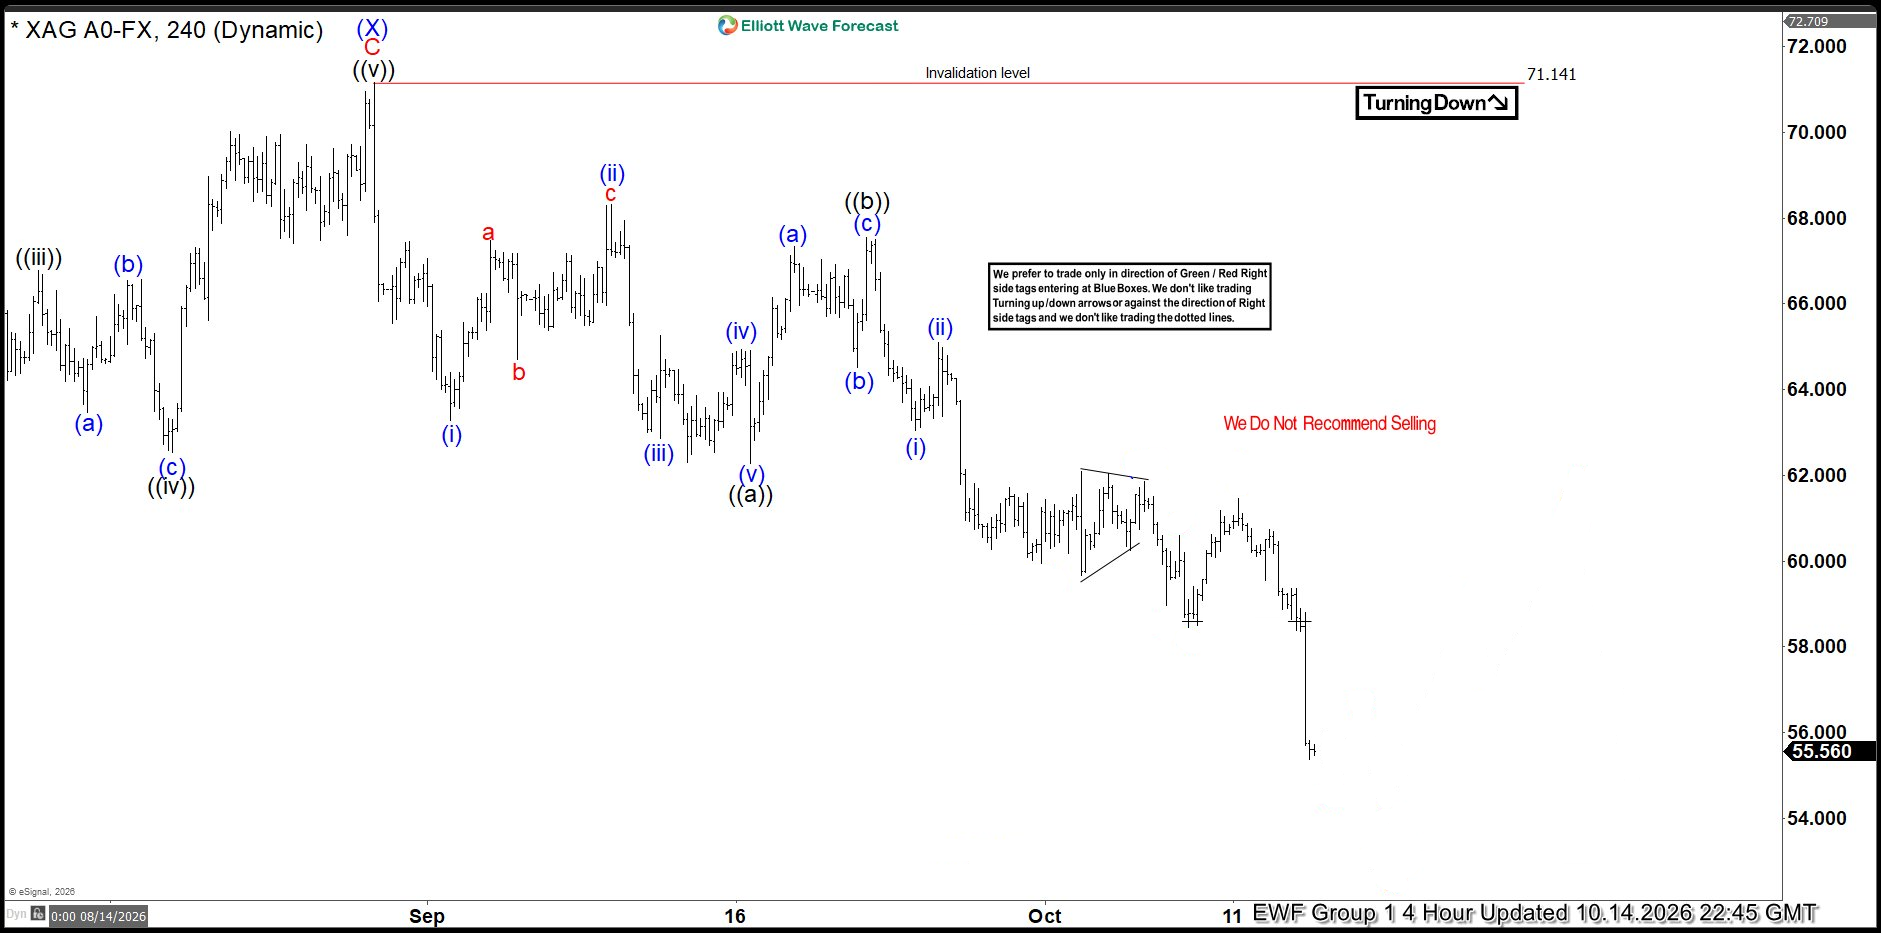
As anticipated in our October 14, 2026 4-hour update, $XAGUSD respected the invalidation level and followed the projected bearish path. Silver accelerated sharply to the downside, breaking well below the initial 60.41 – 58.53 target zone and invalidating nearby support levels along the way. The decline continued to unfold through the lower-degree waves, reinforcing the bearish momentum. Price has since extended toward the 55.56 area, confirming the strength of the downtrend while remaining firmly below the updated invalidation level at 71.141, keeping the broader bearish outlook intact. See chart below
Note: Certain labels have been intentionally concealed to protect the exclusivity of our members.
Key Takeaways for Traders
One of the key lessons from this analysis was the importance of staying aligned with the prevailing trend. By maintaining a bearish outlook while price remained below the 71.122 – 71.141 invalidation zone, traders were able to stay on the right side of the market throughout the sharp decline. Equally important was the disciplined focus on Elliott Wave structure rather than attempting to predict every short-term fluctuation. Despite several intermediate consolidations, the wave count continued to provide clear downside objectives, well-defined risk parameters, and a reliable roadmap for navigating the bearish sequence.
Why choose EWF ?
At Elliottwave Forecast (EWF), we deliver consistent market updates through regular charts update. Our analysts update 1‑hour charts four times daily and 4‑hour charts once per day across all 78 instruments. In addition, we host five live sessions each day and maintain a 24‑hour chatroom, providing clients with real‑time market guidance and answers to any questions they may have.
You can start a 14‑day trial with us today here and cancel anytime by emailing support@elliottwave-forecast.com
Follow on X @NgcoboGen





, comparing our 4-hour forecast from late September 2026 against the price action through mid-October 2026.)