


Key Highlights
- GBP/USD started a steady increase above the 1.3250 resistance.
- It cleared a contracting triangle with resistance at 1.3275 on the 4-hour chart.
- USD/JPY is still consolidating below the 159.00 resistance.
- The UK CPI could increase 3.4% in Sep 2026 (YoY).
GBP/USD Technical Analysis
The British Pound started a fresh increase against the US Dollar. GBP/USD surpassed 1.3250 and 1.3300 to move into a positive zone.
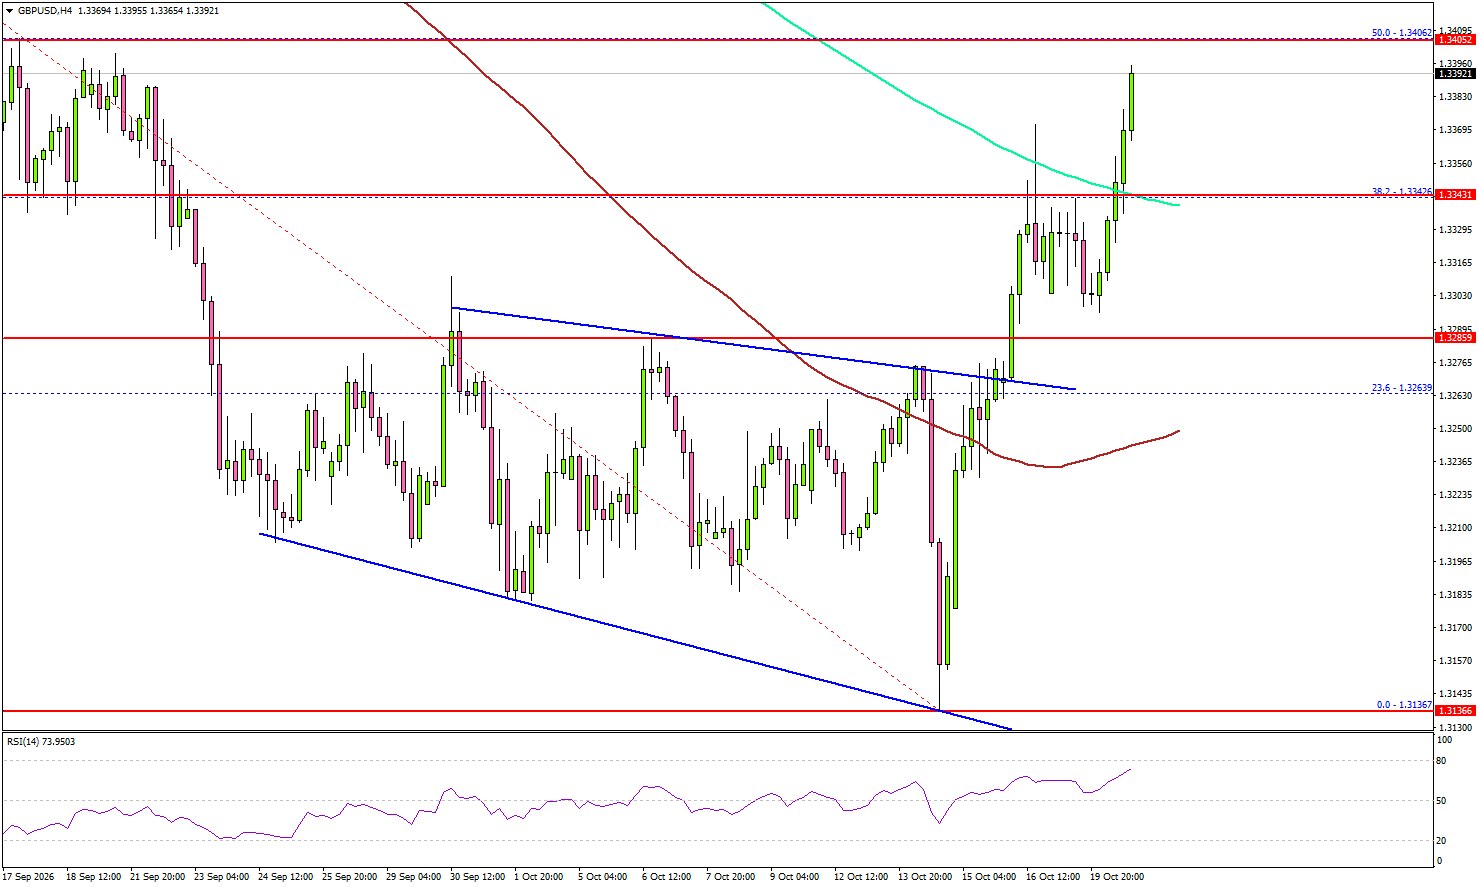
Looking at the 4-hour chart, the pair surpassed the 38.2% Fib retracement level of the downward move from the 1.3756 swing high to the 1.3136 low. More importantly, the pair settled above the 100 simple moving average (red, 4-hour) and the 200 simple moving average (green, 4-hour).
If there are more gains, the pair could face resistance at 1.3400 and the 50% Fib retracement. The first major resistance might be near 1.3440. A close above 1.3440 could start a steady increase. In the stated case, the pair might even surpass 1.3500.
Conversely, the pair could see a pullback. Immediate support could be near the 200 simple moving average (green, 4-hour) at 1.3340. The first major support might be 1.3320.
A close below 1.3320 might accelerate the decline. In the stated case, the pair might drop to 1.3250 and the 100 simple moving average (red, 4-hour). The main support might be close to 1.3200.
Looking at USD/JPY, the pair is still struggling to settle above 159.00 and might see a downside reaction.
Upcoming Key Economic Events:
- UK Consumer Price Index for Sep 2026 (YoY) – Forecast +3.4%, versus +3.1% previous.
- UK Core Consumer Price Index for Sep 2026 (YoY) – Forecast +2.7%, versus +2.6% previous.