


Oil continues to display a bullish Elliott Wave structure despite the ongoing correction. The larger trend remains constructive because the commodity completed a clear five-swing advance from the July 2, 2026 low. This pattern supports the view that buyers remain in control over a higher time frame. As a result, the current pullback appears corrective rather than the start of a larger bearish reversal.
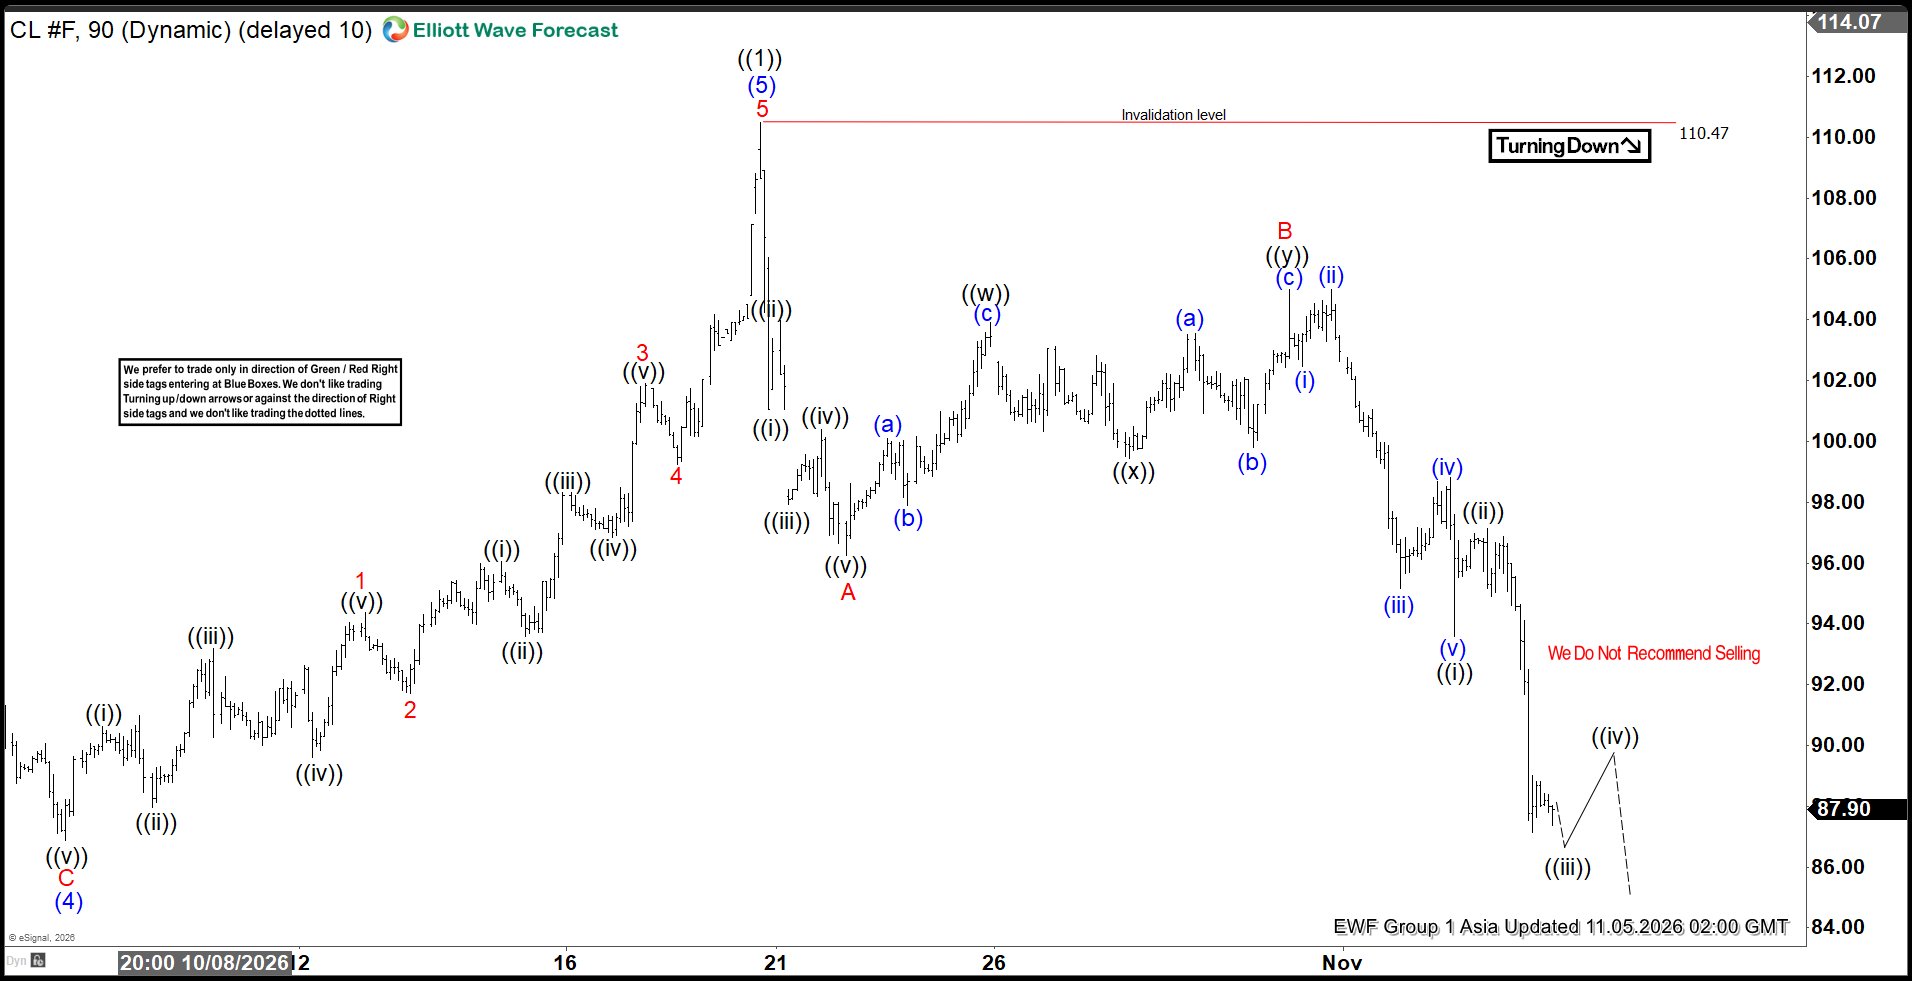
From the July 2 low, wave (1) advanced to $93.50 before wave (2) corrected to $74.24. The market then resumed higher in wave (3), which reached $106.75. A subsequent pullback in wave (4) unfolded and finished at $86.86. From there, Oil extended higher in wave (5) and peaked at $110.48. This five-wave sequence completed wave ((1)) of a higher degree, as shown on the 90-minute chart.
Following the completion of wave ((1)), Oil entered a corrective phase in wave ((2)). This correction aims to retrace a portion of the advance from the July 2, 2026 low before the larger uptrend resumes. The internal structure of wave ((2)) is currently developing as a zigzag pattern, a common corrective formation within Elliott Wave theory.
The decline from the wave ((1)) peak formed wave A at $96.26. Buyers then returned and lifted prices in wave B, which ended at $104.99. Since that high, wave C has been unfolding lower in an impulsive five-wave structure. The decline has already entered the extreme area between $82.20 and $91.00. This zone corresponds to the 100% to 161.8% Fibonacci extension of wave A and represents a region where selling pressure could begin to diminish.
Looking ahead, wave C may still record a few marginal lows before completing wave (W) of ((2)). Once that phase concludes, Oil should stage a recovery in wave (X). That rally would correct the decline from the October 20, 2026 high before another pullback develops. In the near term, the key pivot remains the $110.50 high. As long as this level holds, rallies are expected to fail in three or seven swings and set the stage for additional downside within the ongoing corrective sequence. However, the broader Elliott Wave structure continues to favor higher prices once wave ((2)) reaches completion.
Oil (CL) 90 Minute Elliott Wave Chart
CL Elliott Wave Video
You are currently viewing a placeholder content from Default. To access the actual content, click the button below. Please note that doing so will share data with third-party providers.