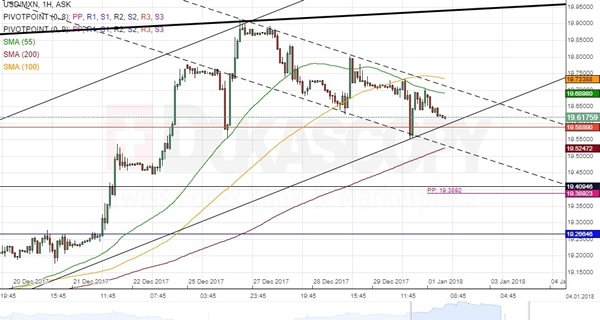
The dominant pattern that has guided the USD/MXN exchange rate for the last six months is an ascending triangle. As apparent on the chart, the pair reversed from its upper boundary on December 25 and has since traded in a narrow channel down. The US Dollar is currently stranded between two important support and resistance areas. The pressure from both sides might force the pair to consolidate in a narrow range in between their bounds. If looking at a longer term, a test of the senior channel should result in a new period of price decline, especially given the pair’s steep appreciation during the past two months. Apart from the 200-hour SMA and the weekly R3, the rate also faces the support of the monthly PP and the weekly R2 near the 19.40 mark.