
A note on lower timeframe confirming price action…
Waiting for lower timeframe confirmation is our main tool to confirm strength within higher timeframe zones, and has really been the key to our trading success. It takes a little time to understand the subtle nuances, however, as each trade is never the same, but once you master the rhythm so to speak, you will be saved from countless unnecessary losing trades. The following is a list of what we look for:
- A break/retest of supply or demand dependent on which way you’re trading.
- A trendline break/retest.
- Buying/selling tails … essentially we look for a cluster of very obvious spikes off of lower timeframe support and resistance levels within the higher timeframe zone.
- Candlestick patterns. We tend to only stick with pin bars and engulfing bars as these have proven to be the most effective.
EUR/USD
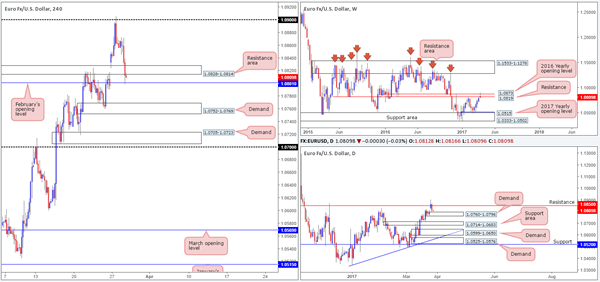
The US consumer confidence survey came in above expectations yesterday, thus sending the EUR lower. H4 price munched through a support area coming in at 1.0828-1.0814, and ended the day shaking hands with February’s opening level at 1.0801.
With H4 action now seen retesting the underside of the recently broken support area as resistance, what’s the most likely scenario in this market today? Well, in view of the current weekly candle selling off from the 2016 yearly opening line at 1.0873 and edging back below resistance at 1.0819, this timeframe certainly reflects somewhat of a bearish tone at present. On the other side of the field, however, the daily chart shows demand sits nearby at 1.0760-1.0796.
Our suggestions: Based on this market’s structure, neither a long nor short seems attractive at this time. A long would place one against both weekly and H4 flow, whereas a sell may have trouble breaking beyond both the H4 monthly level and daily demand! With that in mind, remaining on the sidelines seems to be the better path to take today.
Data points to consider: FOMC member Evans speaks at 2.20pm, US pending home sales at 3pm GMT.
Levels to watch/live orders:
- Buys: Flat (stop loss: N/A).
- Sells: Flat (stop loss: N/A).
GBP/USD
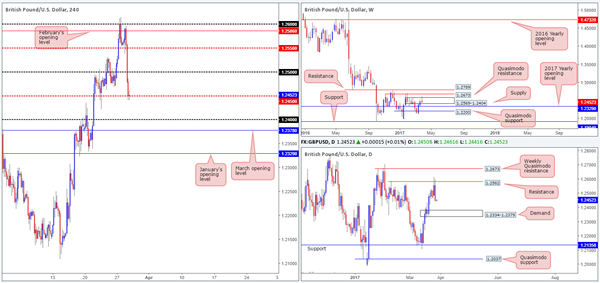
The GBP came under pressure yesterday, forcing H4 price to chomp through both the mid-way point at 1.2550 and the 1.25 handle, with price ending the session challenging the mid-way point at 1.2450. The move, in our opinion, was fueled by a strong performance from the US dollar (helped by the better-than-expected US consumer confidence survey report), coupled with Scotland’s First Minister calling for a new independence referendum in late 2018/2019.
Through the simple lens of a technical trader, 1.2450 looks vulnerable to the downside today. Not only is weekly price seen trading within the walls of a supply at 1.2569-1.2404, but there is also scope seen for the bears to stretch their legs on the daily chart down to demand penciled in at 1.2334-1.2379.
Our suggestions: Watch for the H4 candles to close beyond 1.2450. In the event that this comes to fruition, we’d then require a retest of this number followed by a lower-timeframe sell signal (see the top of this report) to confirm a short. The first take-profit target can be seen at 1.24, shadowed closely by March’s opening level at 1.2378 (positioned within the upper limits of the aforementioned daily demand).
Data points to consider: FOMC member Evans speaks at 2.20pm, US pending home sales at 3pm GMT.
Levels to watch/live orders:
- Buys: Flat (stop loss: N/A).
- Sells: Watch for price to engulf 1.2450 and look to trade any retest seen thereafter ([waiting for a lower-timeframe signal to form following the retest is advised] stop loss: dependent on where one confirms the line).
AUD/USD
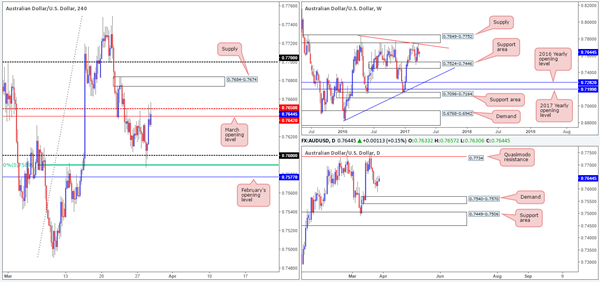
The Aussie bulls went on the offensive yesterday after momentarily breaking through the 0.76 number and tapping the H4 61.8% Fib support level at 0.7589. The advance from here, as you can see, lifted the pair up to March’s opening level at 0.7642/H4 mid-way point 0.7650. A H4 close above these levels could see the unit attempt an approach to the H4 supply at 0.7684-0.7674, whilst a rejection may bring price back down to the 0.76 neighborhood.
Unfortunately, the market remains without bigger-picture direction. Weekly price is seen loitering between supply at 0.7849-0.7752 and a support area at 0.7524-0.7446. Daily action on the other hand, does not show resistance until we reach 0.7734 (a Quasimodo level) or support until 0.7540-0.7570 (a demand zone).
Our suggestions: Due to the lack of room seen above 0.7650 and the fact that there’s no higher-timeframe support in play right now, we have absolutely no interest in buying this market. As for shorts, another H4 rejection candle off March’s opening level/H4 mid-way point could, as mentioned above, encourage sellers to bring prices back down to the 0.76 area. Taking into account that there is less than 40 pips to play with between these levels, and the fact that there’s also no higher-timeframe convergence here, we will be passing on any short signals as well.
Data points to consider: FOMC member Evans speaks at 2.20pm, US pending home sales at 3pm GMT.
Levels to watch/live orders:
- Buys: Flat (stop loss: N/A).
- Sells: Flat (stop loss: N/A).
USD/JPY
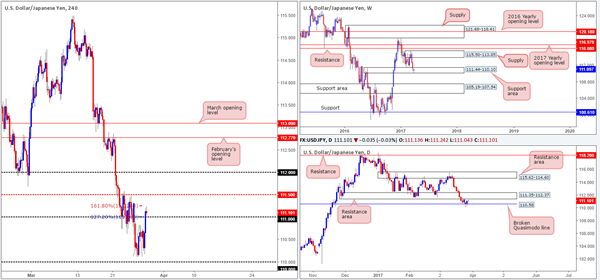
In view of weekly bulls defending the support area at 111.44-110.10, further upside may be seen this week. While this may be true, it might be worth noting that the daily candles are now seen trading within reaching distance of a resistance area coming in at 111.35-112.37.
Swinging over to the H4 chart, we can see that price recently breached the 111 handle and is seen trading nearby a 161.8% Fib ext. at 111.25 (taken from the low 110.11). Since early March, momentum has been firmly on the side of the bears. Therefore, the 161.8% ext., the aforementioned daily resistance area and the mid-way level at 111.50 forms a rather interesting base of resistance. Despite this confluence, there are two cautionary points to consider:
The weekly demand currently in play.
The nearby 111 handle and the daily broken Quasimodo line seen just below it at 110.58.
Our suggestions: Although we believe the bears will eventually break beyond 111, selling below here is just too risky for our liking. Weekly bulls could kick back into action at any minute, and being on the wrong side of this would not do your account any favors! Therefore, it’s back to sitting on our hands for the time being.
Data points to consider: FOMC member Evans speaks at 2.20pm, US pending home sales at 3pm GMT.
Levels to watch/live orders:
- Buys: Flat (stop loss: N/A).
- Sells: Flat (stop loss: N/A).
USD/CAD
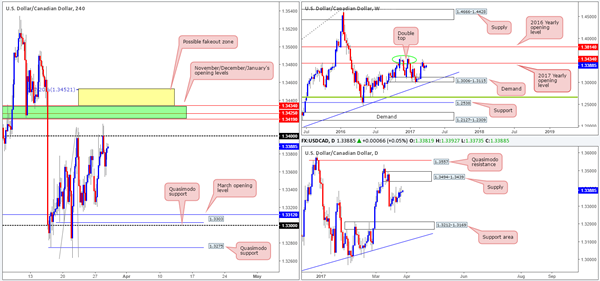
Despite price ranging 60 pips yesterday, USD/CAD structure is little changed this morning. As you can see, the 1.34 handle continues to cap upside in this market. However, the bulls do seem to have the upper hand here at the moment, which could force price to challenge the 1.3434/1.3419 region (November, December and January’s opening levels marked in green). It might also be worth noting that directly above here is a possible H4 fakeout area painted in yellow at 1.3452/1.3434 (the top edge denotes a 127.2% Fib ext. taken from the low 1.3263), which happens to register nicely with the lower limits of a daily supply at 1.3494-1.3439.
Looking over to the bigger picture, weekly action is seen trading within shouting distance of the 2017 yearly opening base line at 1.3434. Daily flow, nonetheless, still offers very little in terms of direction at the moment. The unit is seen meandering mid-range between the aforementioned supply and a support area at 1.3212-1.3169.
Our suggestions: We still have a keen interest in The H4 1.3434/1.3419 region for shorts. Here’s why:
Of note is the 1.34 handle. Psychological levels are prone to fakeouts, and with 1.3434/1.3419 lurking just above 1.34, we feel it’d be a fantastic barrier to help facilitate a fakeout.
When these monthly levels converge, we typically find that they hold firm the majority of the time offering at least a bounce.
In that these monthly levels form a rather small zone, however, and with a somewhat attractive H4 fakeout zone seen above it (attractive due to it being located within daily supply) there is also a chance that price could whipsaw through the monthly levels before turning lower.
To short, we are looking for a H4 bearish selling wick to form that pierces into our pre-determined H4 yellow zone discussed above. With this, a sell from here would be a valid call, in our opinion. From this point, 1.34 could be a potentially troublesome level, so we’d be looking for this base to be consumed, which would in turn be our cue to reduce risk to breakeven.
Data points to consider: FOMC member Evans speaks at 2.20pm, US pending home sales at 3pm. Crude oil inventories at 3.30pm GMT.
Levels to watch/live orders:
- Buys: Flat (stop loss: N/A).
- Sells: 1.3452/1.3419 ([watch for a H4 bearish selling wick to form within this range before considering a short] stop loss: ideally beyond the candle’s wick).
USD/CHF
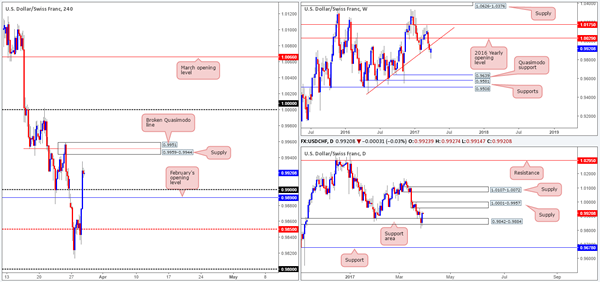
In recent sessions, the USD/CHF aggressively advanced north. February’s opening level at 0.9890 and the 0.99 handle were both consumed during this assault, with price ending the day touching a high of 0.9935. This bull run, however, could be tested today! Over on the weekly scale, price is trading within close proximity to the underside of a recently broken trendline support, which could very well offer resistance. Building on this, there’s a daily supply seen overhead at 1.0001-0.9957 that intersects with the above noted weekly trendline.
Our suggestions: Ideally, we’re looking for the H4 candles to test the supply zone drawn from 0.9959-0.9944, which overlaps with a broken Quasimodo line at 0.9951. The reason for why is because this area is glued to the underside of the aforementioned daily resistance zone. As a result, we would, depending on the time of day, consider selling from here with stops placed a few pips above the supply.
Data points to consider: FOMC member Evans speaks at 2.20pm, US pending home sales at 3pm GMT.
Levels to watch/live orders:
- Buys: Flat (stop loss: N/A).
- Sells: 0.9959-0.9944 (stop loss: 0.9962).
DOW 30
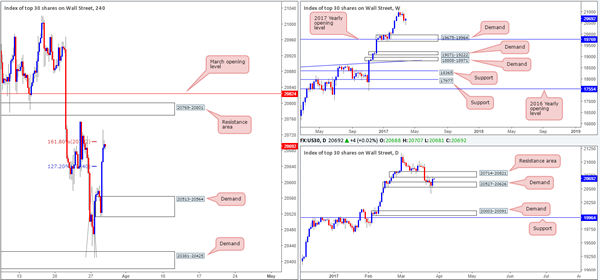
US equities settled around the underside of a H4 161.8% ext. at 20703 (drawn from the low 20410) yesterday, following a rather aggressive continuation move north. Supporting the above noted Fib level is a daily resistance area coming in at 20714-20821. Selling from this region may be inviting due to the H4/daily confluence, but we still remain wary. The reason? Weekly action is in the process of printing a nice-looking buying tail. It takes a lot of money (professional money) to create such a pattern on this scale!
Our suggestions: Before traders look to commit around the current H4 Fib level, we would strongly recommend waiting for a reasonably sized H4 bearish candle to form. Of course, this will not guarantee a winning trade, but what it will do is show seller intent within a relatively strong area of resistance.
Data points to consider: FOMC member Evans speaks at 2.20pm, US pending home sales at 3pm GMT.
Levels to watch/live orders:
- Buys: Flat (stop loss: N/A).
- Sells: 20703 reigon ([waiting for a reasonably sized H4 bearish candle to take shape is advised before pulling the trigger] stop loss: ideally beyond the trigger candle).
GOLD
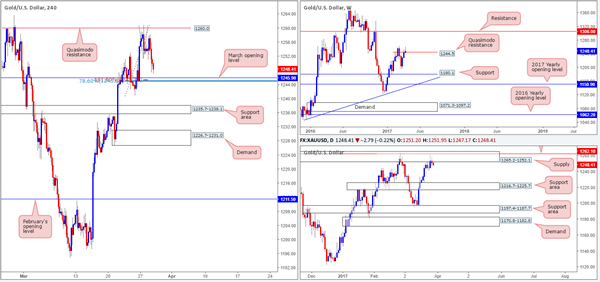
Recent dollar gains saw the price of gold weaken amid trading yesterday. On the H4 chart, this downside move brought price down to within shouting distance of March’s opening level at 1245.9. Further bolstering this level is a 161.8% Fib ext. at 1245.3 taken from the high 1260.9 and a 78.6% retracement penciled in from the low 1240.8 at 1245.0.
While we do expect a bounce to be seen from this neighborhood, let’s not forget to be mindful of the bigger picture here. Weekly movement shows that price is trading above a weekly Quasimodo resistance line at 1244.5. Nevertheless, our desk has noted that until the high of this formation is broken (1263.7), the weekly line will remain valid. In other words, all the while the daily supply area at 1265.2-1252.1 is in play, the bears have the upper hand.
Our suggestions: Based on the confluence seen surrounding the 1245.9 zone, we might look to trade this level for a scalp this morning (still, we would prefer it if this level is confirmed by the lower timeframes beforehand [see the top of this report]). Aiming to trade this level for anything more than a small bounce is risky given the higher-timeframe structures in motion right now.
Levels to watch/live orders:
- Buys: 1245.9 region ([waiting for a lower-timeframe confirming signal to form is advised before pulling the trigger [stop loss: dependent on where one confirms this area).
- Sells: Flat (stop loss: N/A).


