
Currency pair EUR/USD
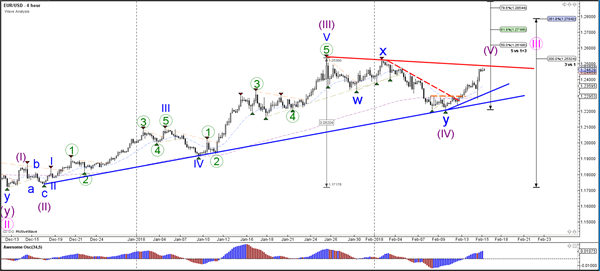
The EUR/USD bullish momentum is now approaching the previous top and resistance trend line (red). A break above the resistance could indicate an uptrend continuation within wave 5 (purple).A bull flag pattern or other chart pattern could indicate a pause before the breakout.
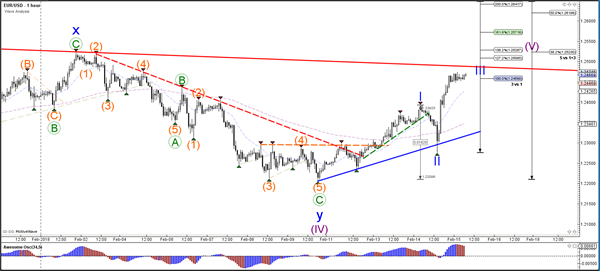
The EUR/USD strong pullback is probably a wave 2 (blue) but the bullish reversal is indicating that this is a potential wave 3 (blue).For price to confirm the wave 3 though, there will need to be a bullish break above the resistance trend line and a move towards the 161.8% Fib target.
Currency pair GBP/USD
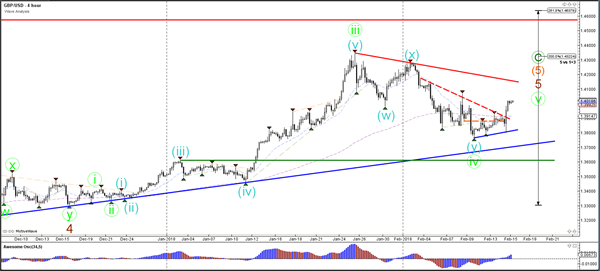
The GBP/USD made a bullish breakout above the previous tops (dotted orange) and resistance trend line (dotted red) which could indicate the start of wave 5 (green). A break above the next resistance (red) trend line could confirm a bullish breakout.
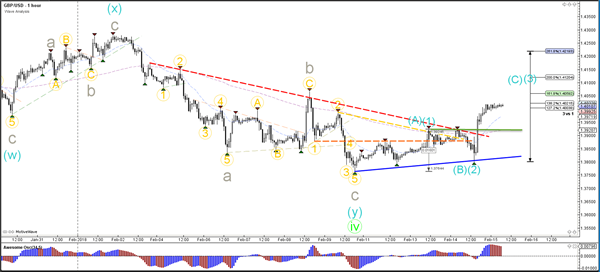
The GBP/USD bullish break is slow and corrective, which could indicate an ABC pattern rather than a 123. If price manages to stay above support (green/blue), then a 123 is more likely. Otherwise, if the support levels should break, then an ABC is more likely.
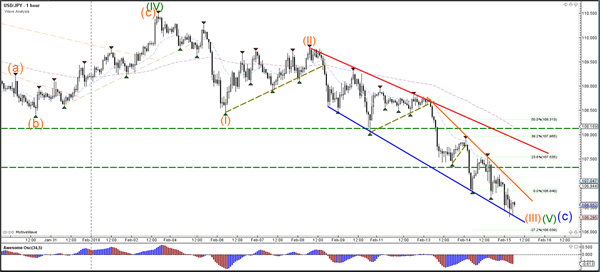
Currency pair USD/JPY
The USD/JPYused thesupportzone (dotted green) as resistance and broke below the -27.2% Fibonacci target. Price now has potential space to the next target which is the -61.8% Fib.
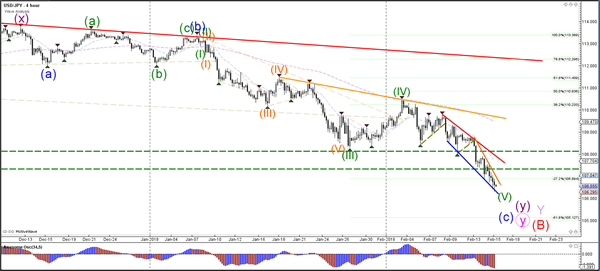
The USD/JPYis at the bottom ofa falling wedge pattern which could indicate a potential bullish retracement.


. A break above the resistance could indicate an uptrend continuation within wave 5 (purple).A bull flag pattern or other chart pattern could indicate a pause before the breakout.)