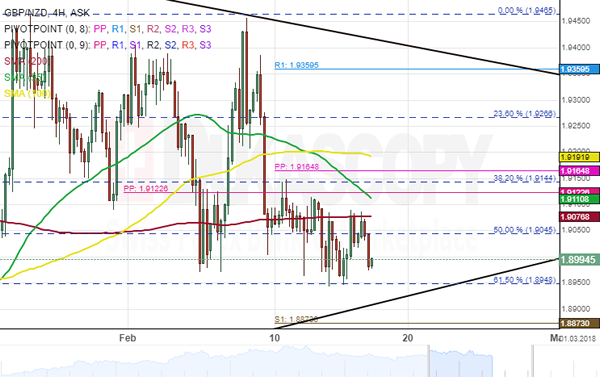
The British Pound has been losing strength against the New Zealand Dollar after hitting the upper boundary of the channel down early December, 2017. The currency pair has formed a triangle during this period.
After reaching the 61.50% Fibonacci retracement level, the GBP/NZD pair began to surge, however, the 200– hour simple moving average is restricting the price movement north. This retracement can be measured by the low at 1.8948 and the high at 1.9467.
During the next trading days, the currency exchange rate could decline further; however, this decline might be stopped by the weekly PP at 1.8873.