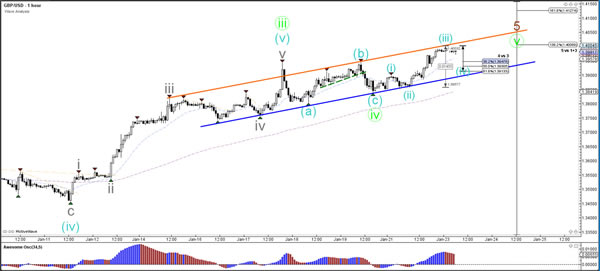
Currency pair GBP/USD
The GBP/USD made a bullish bounce at the support trend line of the bullish channel and price is now challenging the round level of 1.40, which is an important bounce or break spot. A breakout could see price move towards the next Fibonacci target
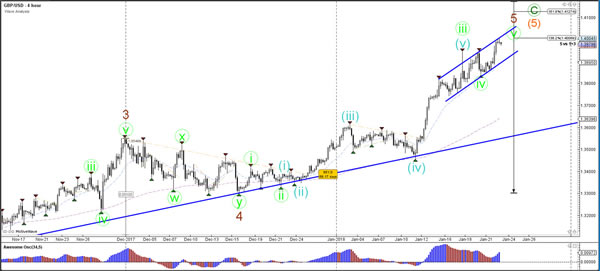
The GBP/USD bullish momentum is probably a wave 3 (blue). Price could build a bearish retracement here at the resistance trend line but the pullback could find support and bounce at the Fibonacci levels of wave 4 (blue).
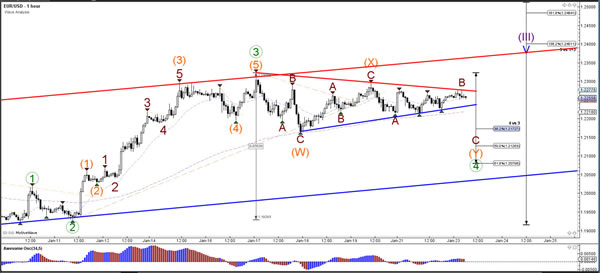
Currency pair EUR/USD
The EUR/USD is in a triangle chart pattern marked by support (blue) and resistance (red) trend lines. A bullish breakout above that resistance trend line (red) could indicate a continuation of the uptrend towards the Fibonacci targets of wave 5 (blue).
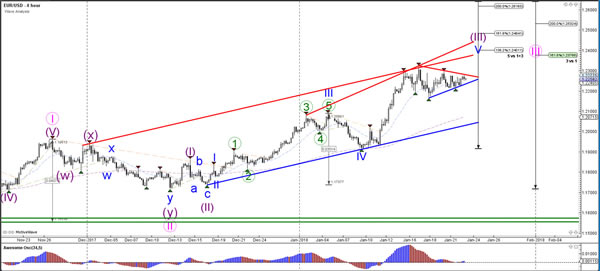
If the EUR/USD breaks below the support trend line (blue) then price could also expand the bearish correction via a bearish ABC (brown) zigzag.
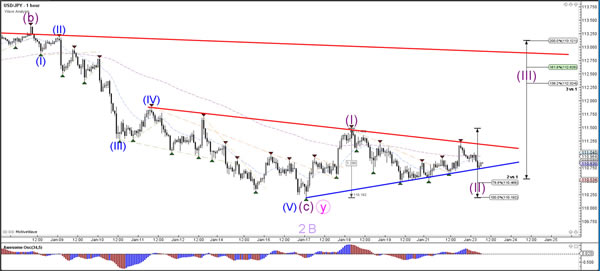
Currency pair USD/JPY
The USD/JPY seems to be stuck between support (blue) and resistance (red) trend lines. A breakout could indicate the new trend direction,
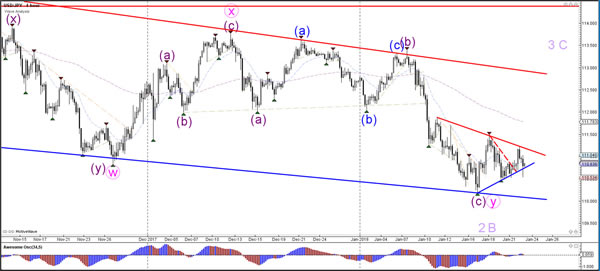
The USD/JPY could be completing wave 2 (purple) and starting a wave 3 (purple) bullish momentum if price manages to break above resistance.