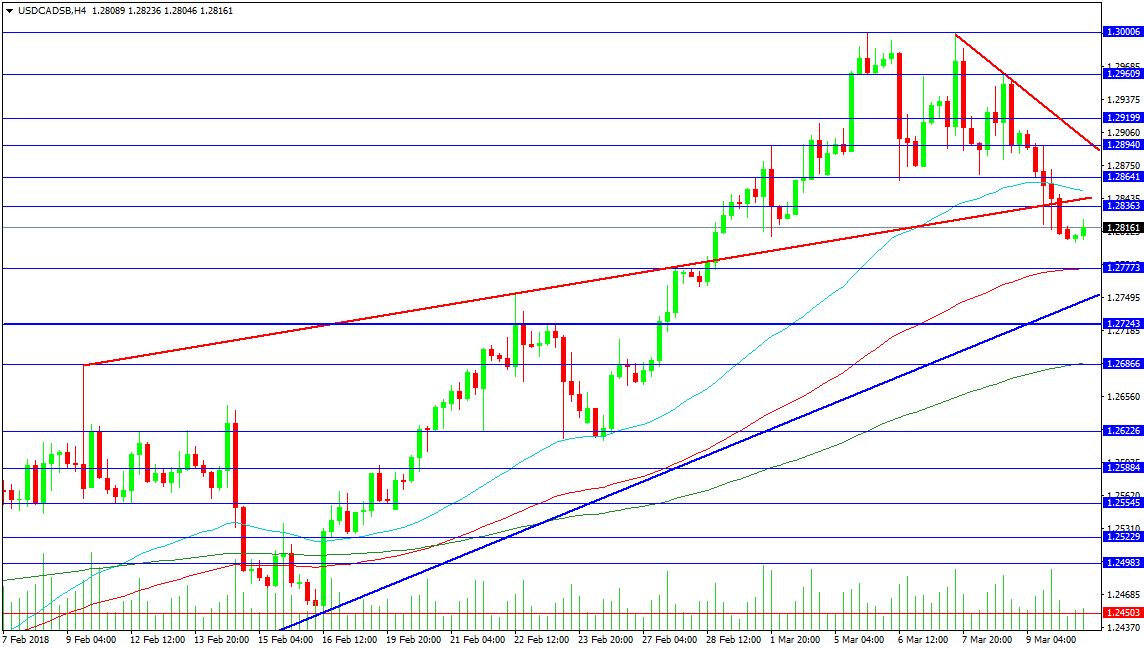
The USDCAD pair has risen to test 1.30000 in recent sessions and has dropped back to test support at 1.28000 as a backstop. As price is caught between these areas, there is a chance we stay in the range until energy is gathered and a direction is found. The trend has been higher during recent weeks, so the bias longer-term is for a resumption of that move. However, the 1.30000 area remains an obstacle and one that the market may find difficult to surpass. At present, it is defended by resistance at 1.29600 and 1.29200, with the 1.29000 level below, which are all seeing interest from sellers. The 1.28940 has proved resistive on the way up and on the way down on this chart, with the 1.28640 area halting moves on a number of occasions. The 1.28400 zone contains the 50-period MA and the rising trend line and this remains the first hurdle to overcome on any move higher.
Support can be found at 1.28000 as mentioned earlier, with the 1.27773 level combing with the 100-period MA today. Below is trend line resistance at 1.27450 and the February 22nd high. Further support is located at 1.27243, with the 200-period MA and the February 9th high at 1.26866. A drop under this area targets supports at 1.26226 and 1.25545.
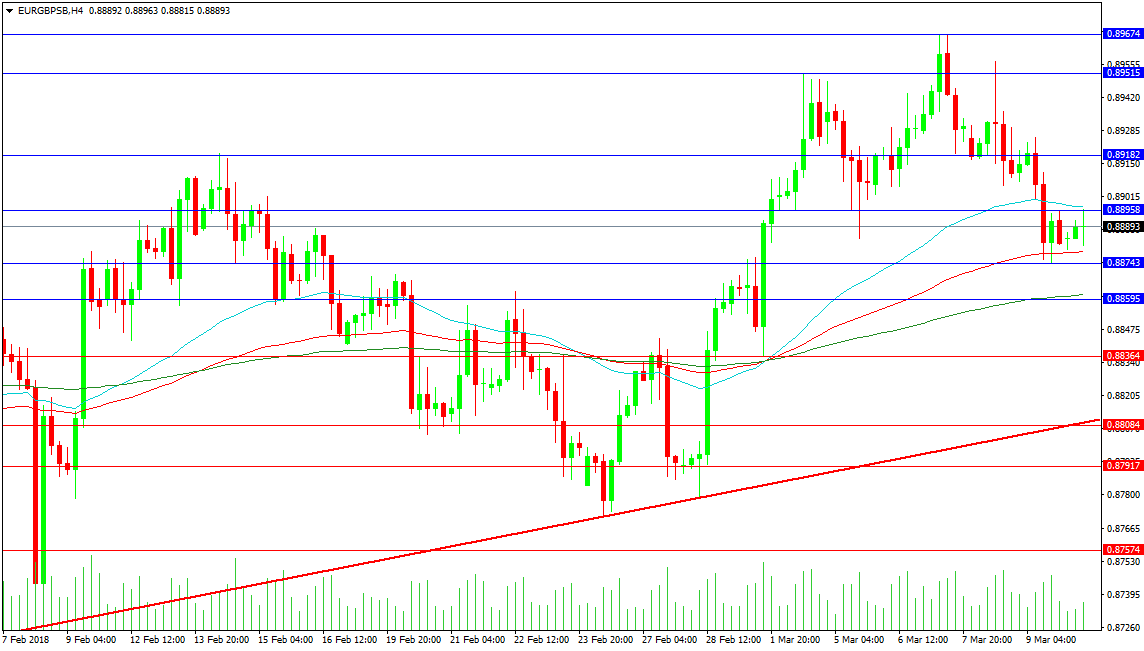
EURGBP
This pair has also dropped back from resistance at 0.89675 and has found support at 0.88743. Price is currently trading between the 50-period MA at 0.88973 and the 100-period MA at 0.88790. Resistance above this area can be found at 0.89182, which is the high from February 14th, followed by 0.89515, which is the March 2nd high. A push above the recent highs would test the 0.90000 area, with strong resistance in play up to 0.90316.
Support can be found at 0.88743, as mentioned, but the drop back under 0.89000 will trouble anyone looking for a push higher. The price has failed to stay above that level on six occasions since November and has continued to trade in a downward sloping sideways range. Support below can be seen at the 200-period MA at 0.88615, followed by 0.88364, which is becoming stronger and may be enough to halt any downward move, or at least slow it significantly. Further major support comes from the rising red trend line at 0.88100 and the 0.88000 level. This trend line is the main supportive element on the chart and a failure here can see price fall as far as 0.87000 or more likely 0.86000.