
Gold rallied during the past week, jumping from three-week lows to one-month highs. Price action is currently taking place above the Ichimoku cloud and the moving average lines, sending bullish signals for the trend of the market, but momentum indicators suggest that any weakness in the short-term should not be a surprise.
The RSI is picking up speed above its neutral threshold of 50, though, it is not far away from overbought levels, hinting that maybe there is not much space left for additional gains. The fast stochastics support this view as well, as the indicator has already reached overbought territory above 80; if the blue %K line consequently moves below the %D line to record a bearish cross, the next price move could be to the downside. The MACD barely holds above zero but is above its red signal line, giving some positive signals.
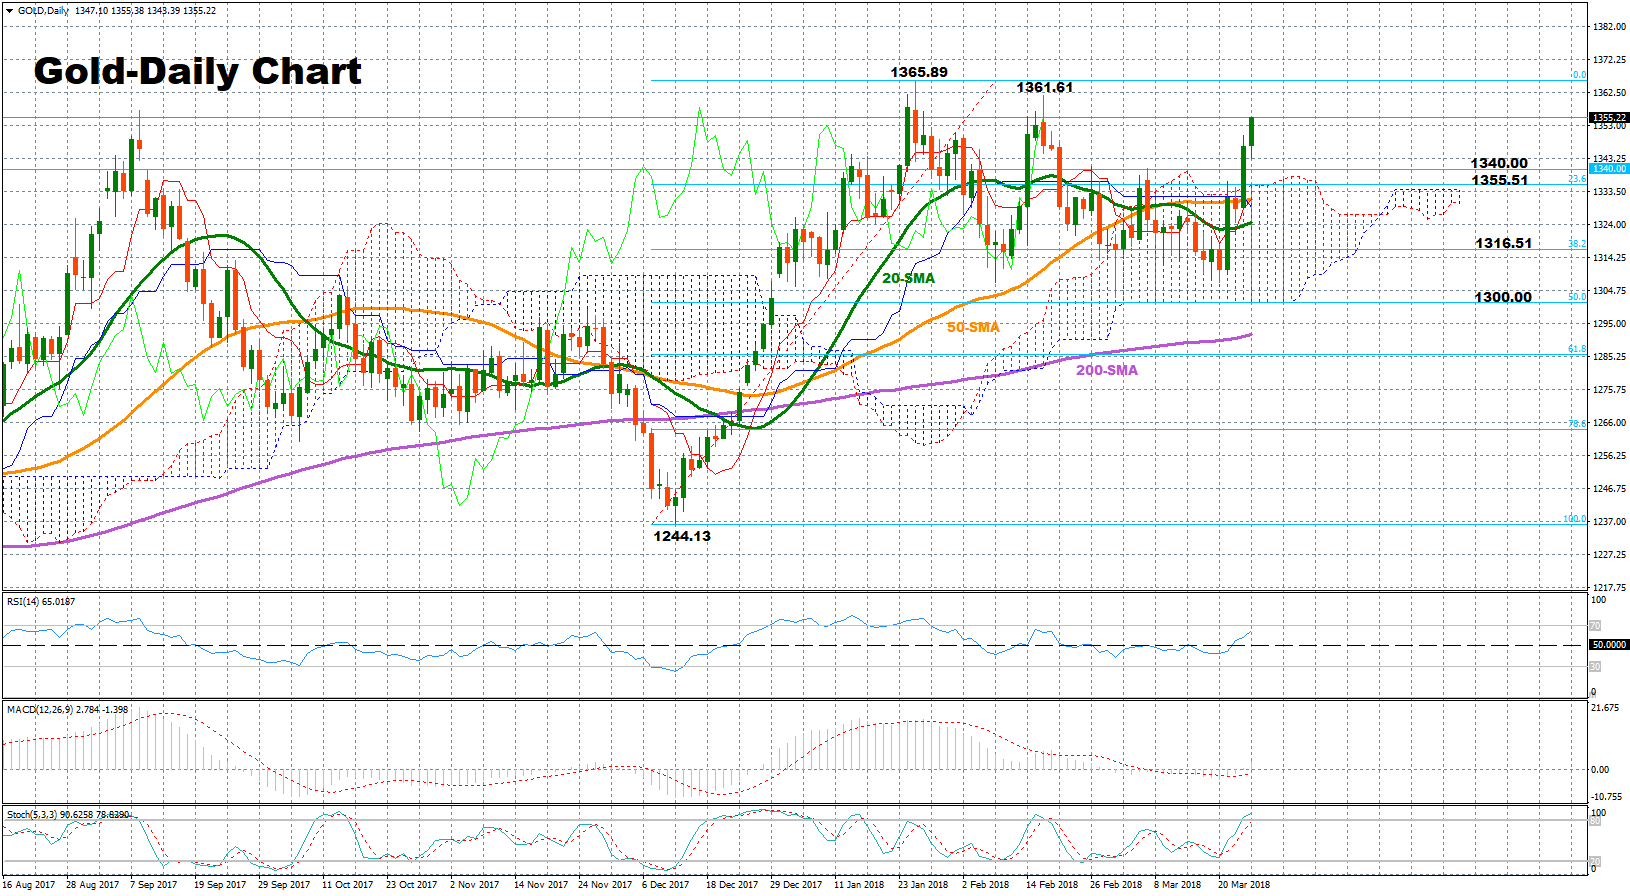
Should the bullish sentiment in the market strengthen, gold could break the 1360 key-level, reaching February’s high of 1361.61. Further above, the next stop could be at the more than 1 ½ -year high of 1365.89 which if broken could bring the uptrend started in mid-December into play. Then from here, the door could open to the 1370 handle.
On the other hand, if prices lose ground, support could come around 1340, a frequently congested area from mid-January onwards, before the focus shifts to the 23.6% Fibonacci of 1355.51 of the upleg from 1244.13 to 1365.89, where the upper bound of the Ichimoku cloud is also roughly located. Looking further down, the area between the 50- and the 20-day simple moving average lines (1331.22 – 1323.55) could come into view ahead of the 38.2% Fibonacci of 1316.51. However, only a break below the 1300 key mark would decisively bring a bear market outlook into play.
Turning to the medium-term outlook, the market structure remains positive given gold’s performance over the last three months. Moreover, as long as market action holds above the 50-day SMA and the bullish cross between the 50- and the 200-day SMA holds in place, the trend is likely to stay on the upside.


