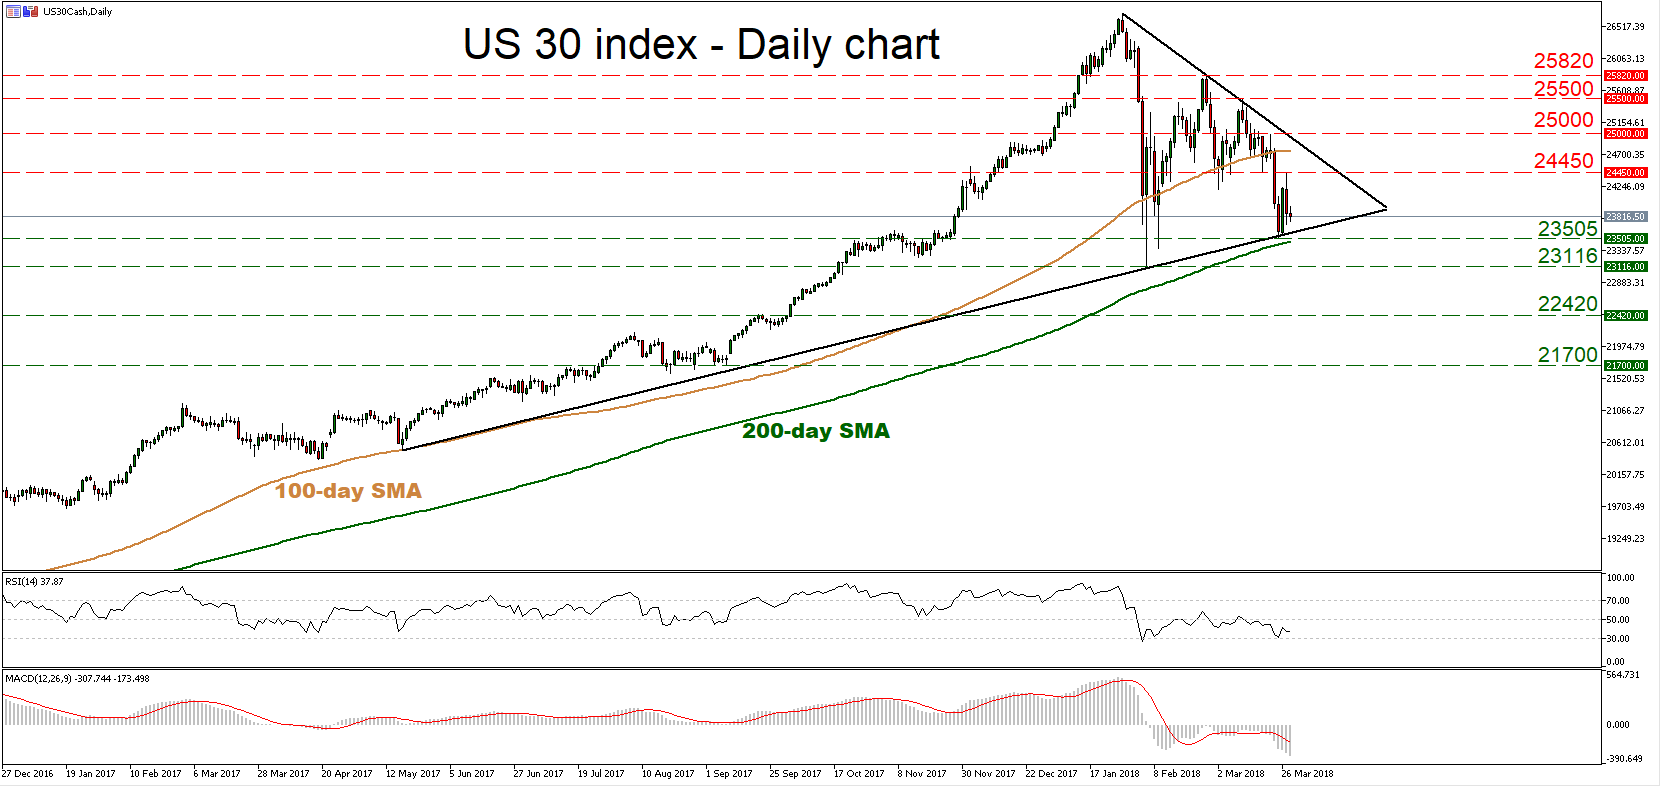
The US 30 index has come under renewed selling pressure, falling back below its 100-day moving average (MA), but remaining slightly above the 200-day MA. Despite the latest pullback though, the index has not posted a fresh lower low, which makes one hesitant to trust further declines for now. Moreover, the price rebounded after it found support near the uptrend line taken from the lows of May 2017, enhancing the argument that the picture may not be entirely negative at the moment. Broadly, the index is trading within a triangle formation, with a break outside it likely to determine the next trend direction.
Looking at momentum oscillators on the daily chart though, they suggest further declines may be on the cards in the short-term. The RSI is below its neutral 50 line, detecting negative momentum, and is also pointing downwards. The MACD, already negative, lies below its trigger line.
In case of further declines in the index, immediate support may be found near the latest lows at 23,505, an area that also encapsulates the 200-day MA at 23,410. A downside break of that zone would open the way for the February bottom of 23,116. If sellers manage to push below that hurdle too, that would mark a lower low on the daily chart, increasing the probability for further bearish extensions. Support may be found initially near 22,420, identified by the September 20 top, with subsequent declines bringing the 21,700 barrier into focus, marked by the September 5 lows.
On the flipside, if the bulls retake control, price advances may stall initially near the latest highs at 24,450, and subsequently near the psychological figure of 25,000. A potential upside violation of 25,000 would also coincide with a break of the downtrend line taken from the index’s all-time high achieved on January 29, raising the likelihood for more advances. In such a case, the 25,500 and the 25820 levels could act as barriers to the upside, identified by the March 12 and the February 27 highs respectively.