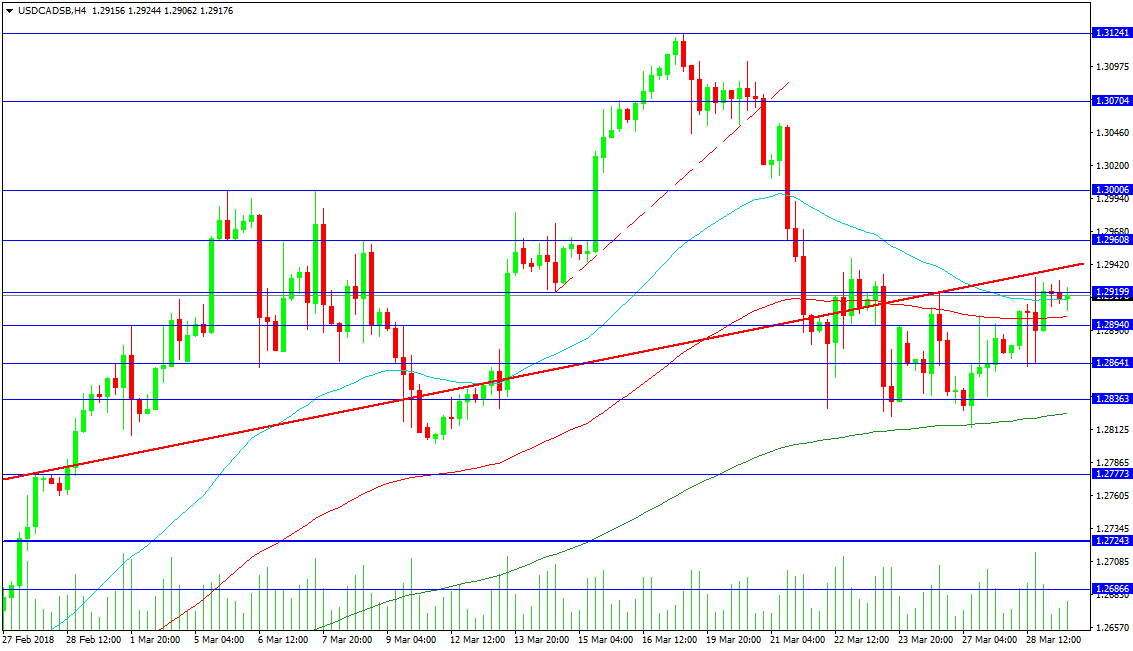
Canadian GDP will be released later today showing slight growth. The USDCAD pair has slipped into a sideways pattern below the area of the red trend line, shown here on the 4-hour chart. This trend line currently represents resistance and is located at the 1.29395. The 50-period MA is at 1.29148, with the 100-period below at 1.29010. The moving averages are playing a role, with the 100 and 200 both being used recently.
The 200-period MA was used as support and created the low from the 27th at 1.28141 but has since moved up to 1.28254. Further support is found at 1.27773 and 1.26866.
Resistance would be tested on a break above the trend line, which was confirmed on Monday. The 1.29608 level has been used as support and resistance and is an outpost of the 1.30000 level. The previous highs are found above 1.30704, at the 1.31241 level.
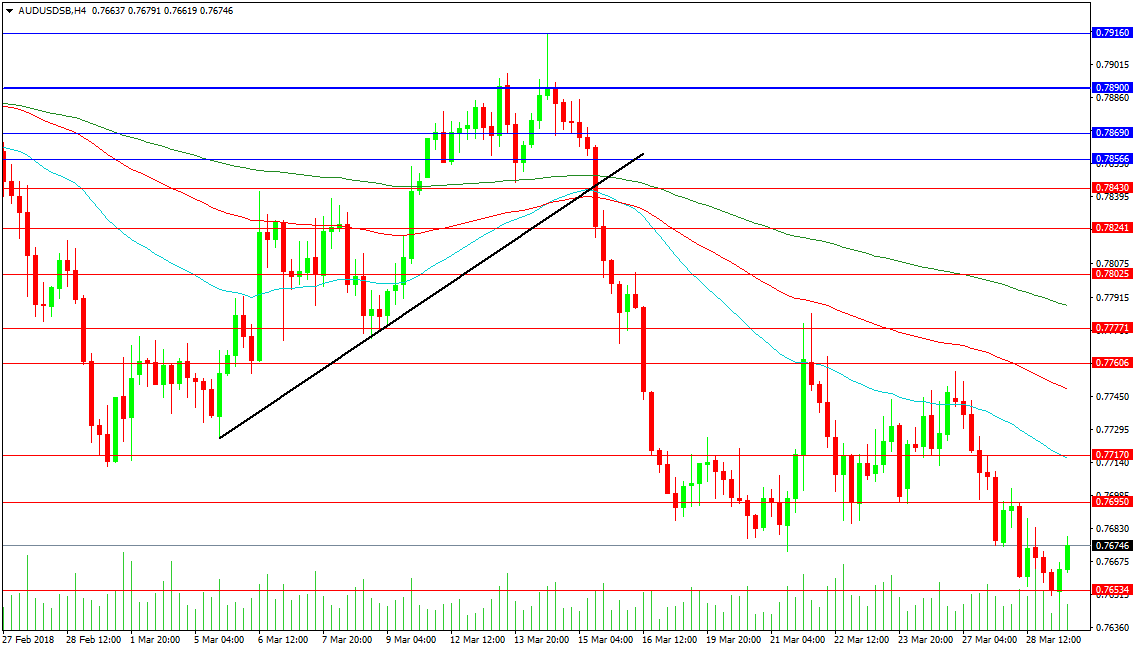
AUDUSD
This pair has come under pressure, testing and breaking through the 0.77000 level. The moving averages on the 4-hour chart are falling and have been used as resistance. Support is found at 0.76534 and the low from overnight at 0.76422. Below this level, 0.76000 comes into play, with 0.75378 and 0.75000 below. This level is just above the November 2018 low of 0.74990.
Resistance at the 50-period MA is at 0.77170, with the 100-period MA at 0.77484. The 200-period MA is falling through 0.77876, with resistance at the 0.78000 level close above. A reversal above that level would suggest a push higher is on the cards, with 0.78430 a hurdle on the way to targets at 0.78900 and 0.79160.