EUR/USD
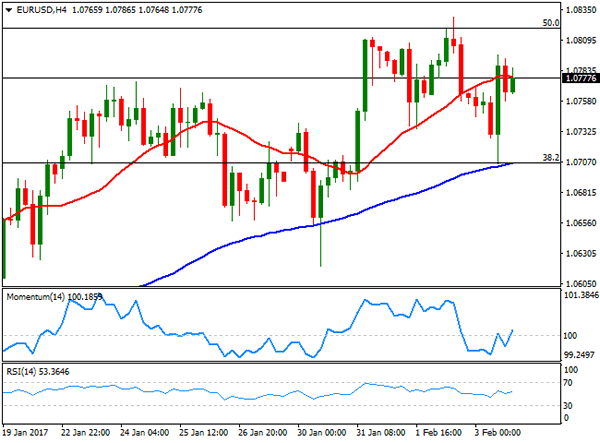
The EUR/USD pair extended the rally coming from early January in these last few days, reaching a new yearly high of 1.0828, settling finally at 1.0777, above a bearish 100 DMA for the first time since October 2016. Dollar’s weakness was fueled by a neutral FOMC’s stance in its latest meeting, and a mixed employment report coming from the US. The January NFP report showed that job’s creation remains strong, as the country added 227,000 new jobs, but wage growth slowed to 2.5% yearly basis from previous 2.9%, while on a month-to-month comparison wages advanced 0.1% against 0.2% expected or the 0.4% previous. The unemployment rate ticked higher, from 4.7% to 4.8% as the participation rate increased to 62.9%, a four-month high.
Eurozone data released at the beginning of the day was also mixed, as retail sales declined by 0.3% in December, but the final Markit services and composite PMIs for the region, signaled continued economic expansion at the beginning of the year, with the EU composite PMI printing 54.4, matching December reading and the highest since May 2011. For this upcoming week the macroeconomic calendar will be light, which means that attention will remain on politics.
From a technical point of view, the pair is poised to extend its advance according to technical readings in the daily chart, as indicators have recovered from a downward correction within positive territory, maintaining their bullish slopes. In the same chart, the 20 DMA presents a bullish slope, hovering near the 1.0710 Fibonacci support, the 38.2% retracement of the November/January decline, while the 100 DMA maintains a bearish slope, a few pips above the region. In the 4 hours chart, the price is stuck around a bullish 20 SMA, but the 100 SMA stands also in the 1.0700/10 region, while technical indicators turned higher in neutral territory. The 50% retracement of the mentioned slide stands around 1.0820, while the 1.0800/40 region has proved strong all through 2015 and 2016, being the resistance area to beat to confirm a steeper advance this week.
Support levels: 1.0750 1.0710 1.0650
Resistance levels: 1.0800 1.0840 1.0885
USD/JPY
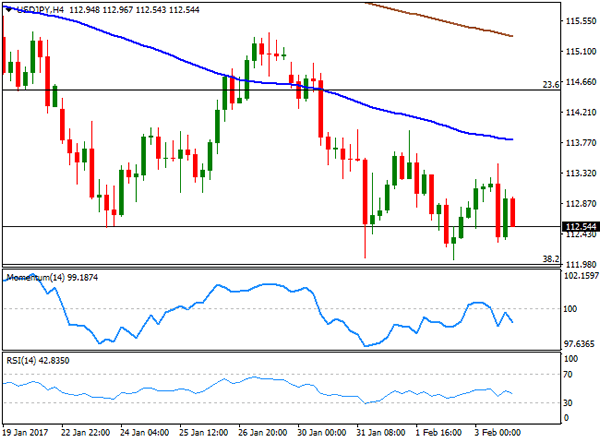
The USD/JPY pair flirted with the 112.00 level twice during this past week and settled at 112.54, its lowest since late November 2016. Broad dollar’s weakness weighed on the pair following the release of a mixed US job’s report, which showed soft wages’ growth. On Friday, US stocks closed higher, while US Treasury yields recovered to close the week with gains, something that usually weighs on the Japanese currency, but didn’t work this time, as speculative interest is starting to perceive the latest BOJ’s monetary policy, focused on controlling the yield curve, as ineffective. Next February 10th, PM Abe will meet with Donald Trump, with both leaders aiming to deepening the bilateral trade and investment relationship, according to the White House. The pair is biased lower for these upcoming days, although the mentioned 112.00 level is a major support, as it stands for the 38.2% retracement of the 101.18/118.66 rally. In the daily chart, the Momentum indicator was rejected from its 100 level, and heads sharply lower within negative territory, whilst the RSI presents a bearish slope, now around 40, in line with further slides. In the same chart, the 100 SMA heads higher around 111.25, the probable bearish target should the mentioned Fibonacci support give up. Shorter term and according to the 4 hours chart, the risk is clearly towards the downside, with the price developing below a bearish 100 SMA and technical indicators heading south within negative territory.
Support levels: 112.00 111.60 111.25
Resistance levels: 113.00 113.45 113.90
GBP/USD
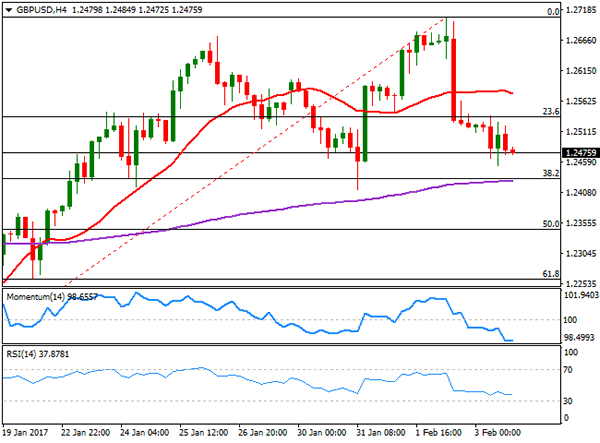
The GBP/USD pair closed the week at 1.2475, with the Pound taking a double hit during the past days, as the BOE showed little rush to raise rates, despite rising inflation, and softer data at the beginning of the year. The UK January Markit services PMI released this Friday fell to 54.5 against December’s 56.2 reading, in line with the soft manufacturing and construction figures released earlier this week. Also, weighing on Pound is the upcoming Brexit, as the UK government has formally set out its plans for exiting the EU with a 70-page white paper. The withdrawal bill will return to the House of Commons this week, and the vote is expected to be passed this Wednesday, clearing the path for PM May to trigger Article 50 on March as planned. From a technical point of view, the daily chart shows that the price held above the 38.2% retracement of the 1.1986/1.2705 rally at 1.2430, while a bullish 20 SMA reinforces the static support, heading higher a few pips below it. Technical indicators in the mentioned chart, however, hover within neutral territory, with the RSI heading lower around 51, indicating limited buying interest. In the 4 hours chart, the technical picture favors the downside, with indicators heading south near oversold readings, and the price well below the 20 SMA, this last around 1.2580.
Support levels: 1.2430 1.2390 1.2350
Resistance levels: 1.2495 1.2540 1.2585
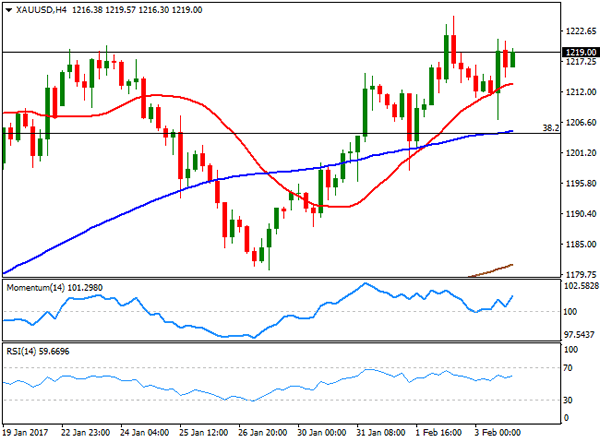
GOLD
Spot gold recovered the ground lost in the previous week and closed last Friday at$1,219.00, its highest settlement since past November, backed by a neutral FED that gave no clues on upcoming rate hikes. Adding to gold’s positive momentum is increasing global economic uncertainty and the continued unwind of the so-called "Trump-trade," as the new US administration failed to provide policies leading to a stronger economic expansion in the world’s largest economy. On the contrary, the protectionist policies announced so far, indicate trade trouble ahead. Gold’s daily chart shows that the Momentum indicator heads modestly higher above its 100 level, but that the RSI indicator accelerated its advance, standing now around 64, whilst the price settled above the 20 and 100 DMAs, both around 1,204/10, all of which supports additional gains. Around 1,230.00, the pair has the 50% retracement of the November/December slide, and an extension beyond it will probably indicating a steeper advance for this upcoming week. In the 4 hours chart, technical indicators are heading higher well above their mid-lines, whilst the 100 SMA converges with the 38.2% retracement of the mentioned decline at 1,204.50, providing a strong support in the case of downward move.
Support levels: 1,211.56 1,204.50 1,196.10
Resistance levels: 1,225.23 1,231.10 1,241.35
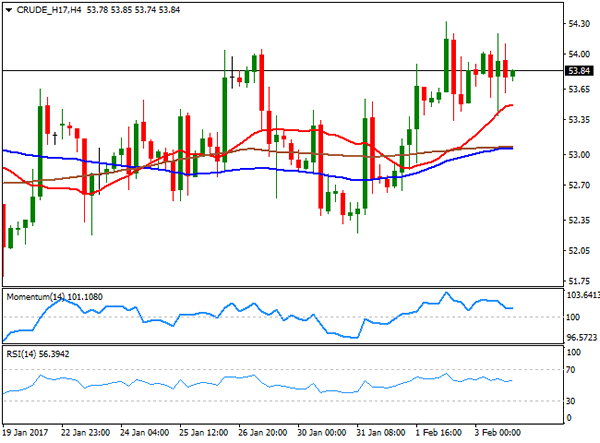
WTI CRUDE
Crude oil prices advanced within range this past week, with West Texas Intermediate crude futures settling at $53.84 a barrel. The commodity remains trapped between positive news of output cuts within the OPEC, and negative ones that show that US production keeps increasing. Gains at the end of the week, however, were triggered by news that the US will impose sanctions to Iran after the country performed a ballistic missile test launch. WTI closed the day pretty much unchanged on Friday, holding near the upper end of its latest range with a neutral-to-bullish bias in the daily chart, given that the price stands above all of its moving averages that anyway lack directional strength, whilst technical indicators hover within positive territory, also without clear momentum. In the shorter term, the 4 hours chart the 20 SMA heads modestly higher, moving away from the 100 and 200 SMAs, while the price is above all of them, but technical indicators have turned lower within positive territory, indicating limited buying interest at current levels.
Support levels: 53.20 52.65 52.00
Resistance levels: 54.30 55.10 55.70
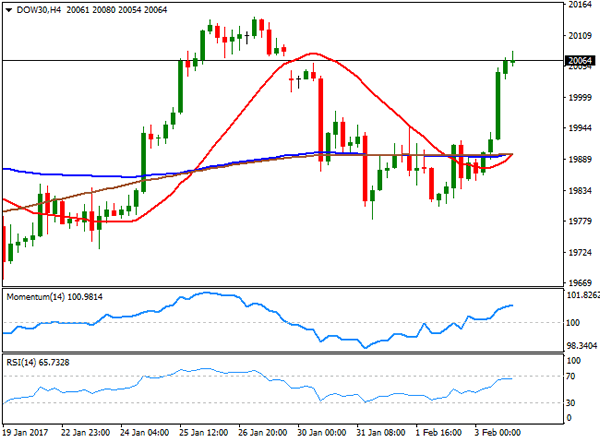
DJIA
Wall Street surged on Friday, with the Dow Jones Industrial Average settling at 20,071.46, up by 186 points or 0.94%, boosted by news that President Trump began working to curb financial regulations, by undoing parts of the Dodd-Frank reforms of the banking industry. The Dow settled lower for the week anyway, by 0.11%. The Nasdaq Composite added 30 points and closed at 5,666.77, whilst the S&P finished at 2,297,42, up 0.73%, both modestly up weekly basis. Financial stocks led the way higher, and within the DJIA, Visa was the best performer, up by 4.59%, followed by Goldman Sachs, up by 4.57% and JP Morgan which added3.06%. Nike was the worst performer, down 0.83%. Technically, the daily chart for the Dow shows that the index is not far from the record highs set last January, well above a flat 20 DMA, but far above a bullish 100 DMA, whilst technical indicators have bounced from their mid-lines, maintaining strong upward slopes ahead of Monday’s opening. In the 4 hours chart, the moving averages converge at 19,900, the Momentum indicator maintains its bullish slope, while the RSI consolidates at 65, all of which maintains the risk towards the upside, favoring a new leg higher on a break above 20,080, Friday’s high.
Support levels: 20,031 19,975 19,923
Resistance levels: 20,080 20,141 20,200
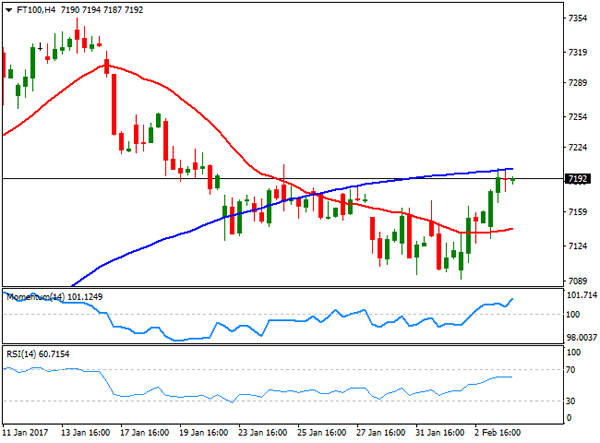
FTSE 100
The Footsie advanced on Friday, up 47 points or 0.67% to close at 7,188.30, helped by a recovery in financial-related equities. Barclay’s was the best performer, advancing by 3.39%, followed by Prudential that added 2.09%. Royal Bank of Scotland closed 2.70% higher. Gains were offset by mining-oriented equities, as metal prices fell, with Glencore topping losers’ list, down 4.77%, followed by Rio Tinto that shed 3.54% and Anglo American that closed 3.30% lower. The recovery was not enough to confirm further gains ahead, as in the daily chart, the 20 SMA caps the upside at 7,128, whilst technical indicators have turned modestly higher, with the Momentum still below the 100 line, but the RSI at 56, somehow anticipating an upward extension, to be confirmed by an upward acceleration through the mentioned resistance. In the 4 hours chart, the RSI indicator turned flat at 60, the Momentum heads higher within positive territory, whilst the index is trapped within horizontal moving averages, in line with the longer term perspective.
Support levels: 7,128 7,091 7,042
Resistance levels: 7,212 7,258 7,312
DAX
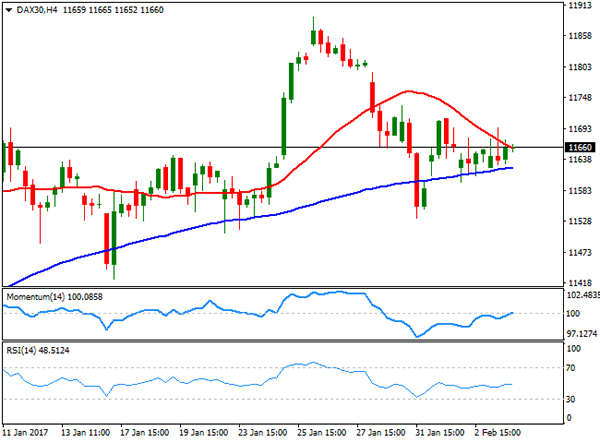
The German DAX edged modestly higher on Friday, adding 23 points or 0.20% to settle at 11,651.49, bud down for the week. Stocks across Europe opened with a soft tone and traded in the red for most of the session, weighed by Chinese monetary policy’s measures, but recovered alongside with Wall Street following the release of the NFP report. Continental was the best performer, up by 3.81%, followed by Deutsche Bank that added 2.68%. Heidelberg Cement topped losers’ list, down 1.21%. The daily chat shows that the index has been confined to a tight range during the second half of this past week, turning technically neutral, as the index is stuck around a horizontal 20 SMA, whilst indicators are flat around their mid-lines, lacking directional strength. In the 4 hours chart, the index is between its 100 and 200 SMAs, both within a 50 points, range, the RSI indicator is horizontal around 48, while the Momentum aims modestly higher around its 100 level, also lacking technical clues on what’s next for the index.
Support levels: 11,609 11,550 11,000
Resistance levels: 11,711 11,770 11,804