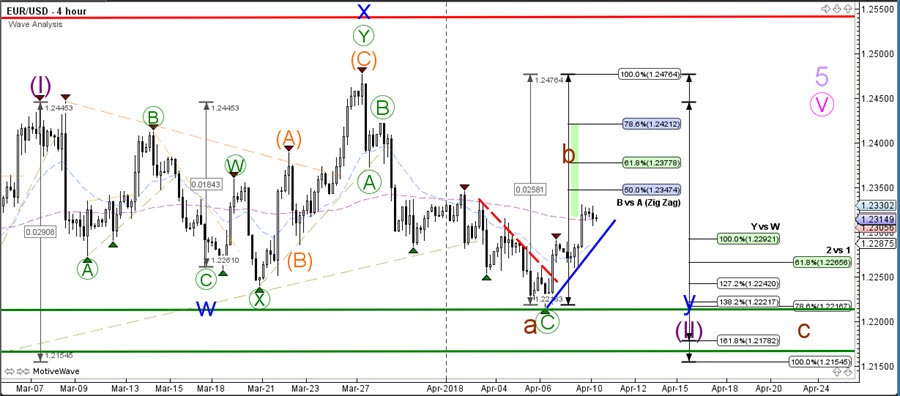
The EUR/USD remains a difficult currency pair to analyse as price is moving sideways for a lengthy period of time. The bullish breakout could be limited as price challenges potential Fibonacci levels of wave B (brown). A bearish break below the support (blue) could create a larger ABC (brown) whereas a bullish continuation could indicate a larger correction might not take place.
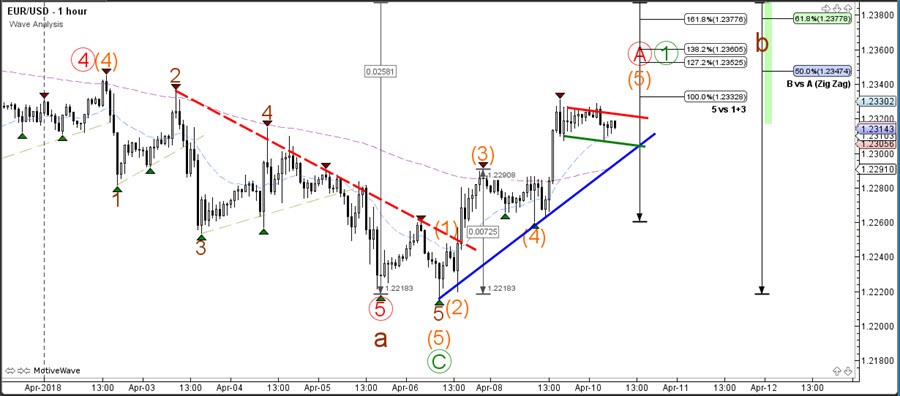
The EUR/USD is building a potential bull flag chart pattern but price will need to break the pattern before a larger bullish continuation is likely. Price could have completed 5 bullish waves which could be part of a wave A (red) within wave B (brown). A break below the support line (blue) could create bearish downside within wave B.
USD/JPY
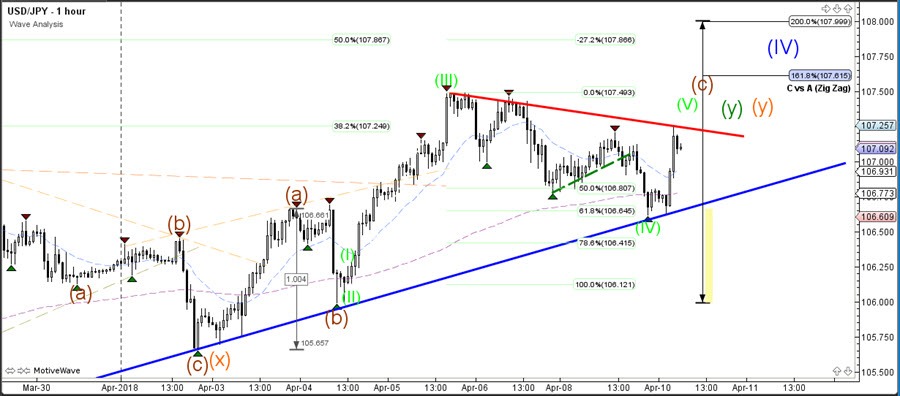
The USD/JPY bounced at the support trend line (blue) which could indicate a bullish push if price breaks resistance (red). Price is also challenging the Fibonacci levels of a potential wave 4 correction (blue). A break above the shallow Fib levels such as the 38.2-50% Fibs makes such a wave 4 unlikely and that would change the wave perspective to bullish.
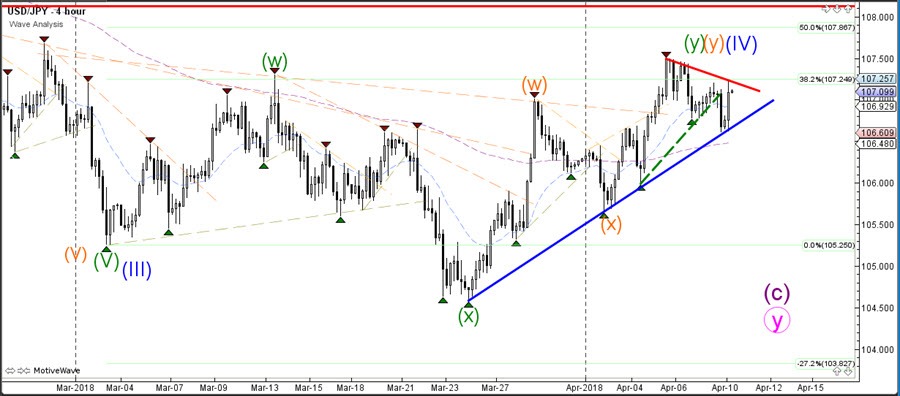
The USD/JPY respected the Fibonacci support levels. One more push higher could take price to the 50% Fib whereas a bearish break below the support trend lines could indicate a trend reversal.