
Since then, price has been playing out brilliantly and gold continues to tighten up as shown on the XAUUSD weekly chart below. You can see we’re at the point now where price looks coiled to explode to the upside and there’s very little resistance overhead until around the 1571 level.
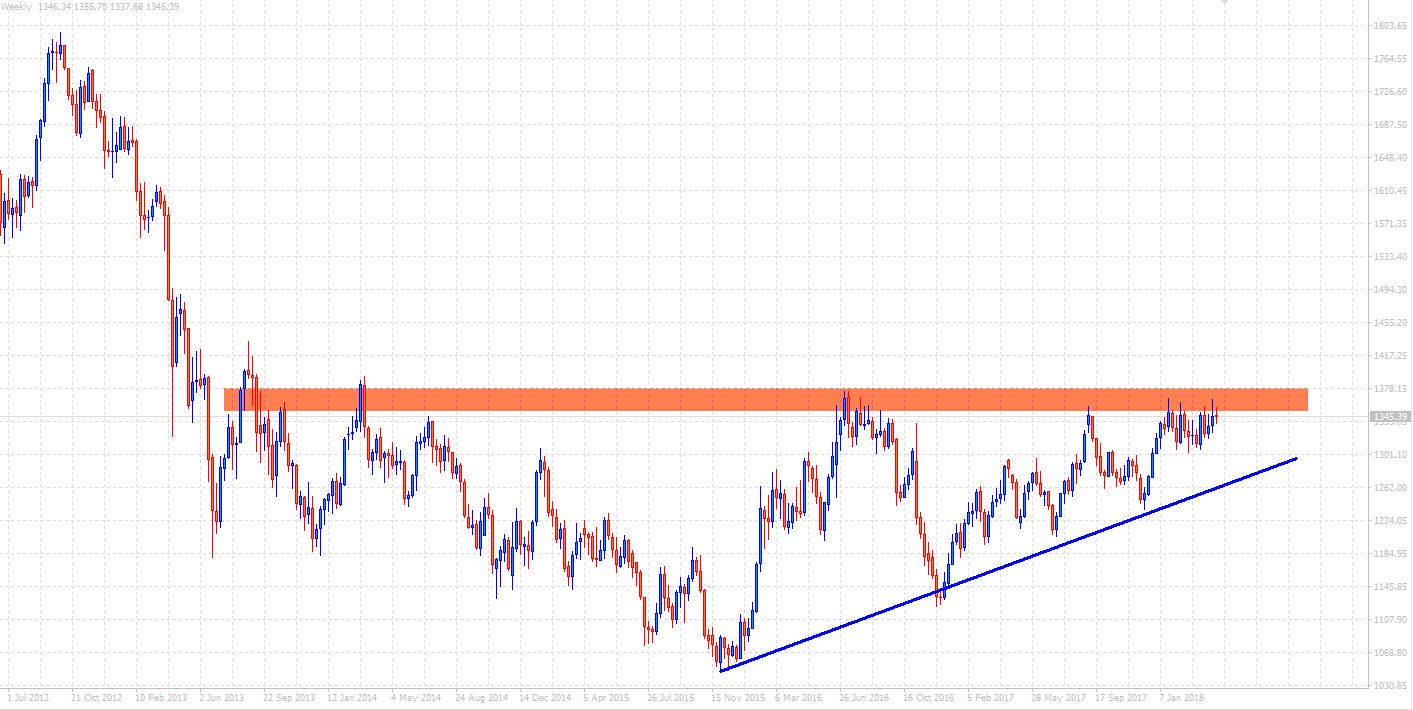
Let’s look at it a bit closer on the daily chart.
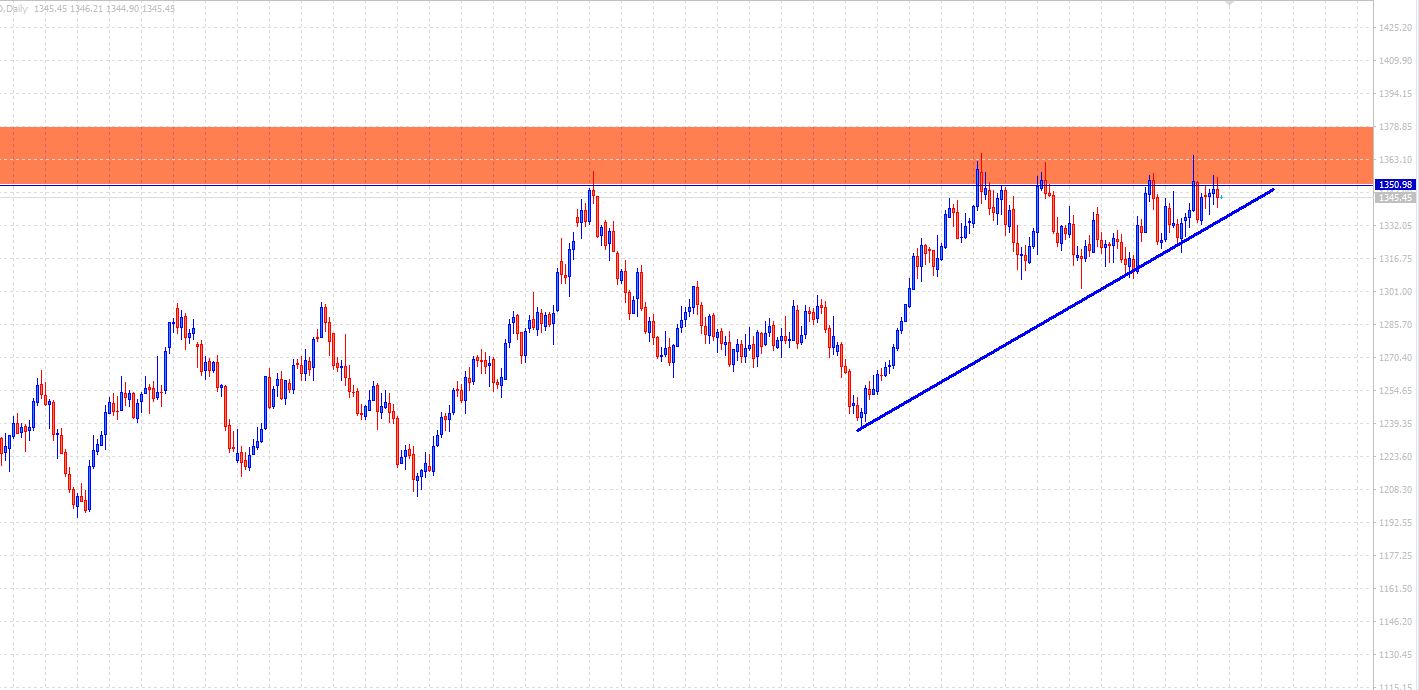
A convincing break above our red resistance area could indicate the beginning of a significant long term bull trend. There are a couple of ways a trader could play a setup like this. You could buy the breakout, or if you miss that you could potentially buy the retrace of price back to our breakout area.
Either way, always wait for the break or whatever you use for confirmation. To me, this is pretty much as textbook as it gets and i’ll continue to watch closely.


