There is something about the USD/THB pair that you can observe only by changing the time frames of the charts while having set up them to show the 200-period simple moving average.
Namely, the most important is the fact that the currency exchange rate has passed the 200-day SMA, which has kept the pair lower since the start of 2017. In addition, the four hour time frame 200-period simple moving average has recently been broken.
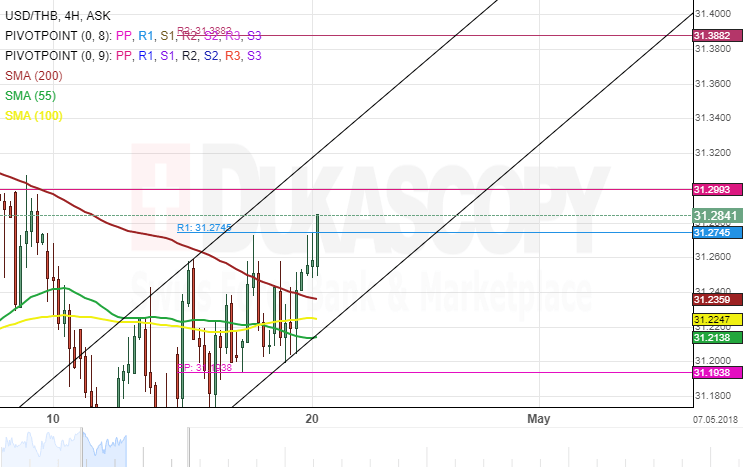
As a result of these moves in a combination with the passing of the weekly R1, the rate began a surge. The surge is set to be paused by a monthly pivot point at 31.30. However, above that there is almost nothing until 31.40.