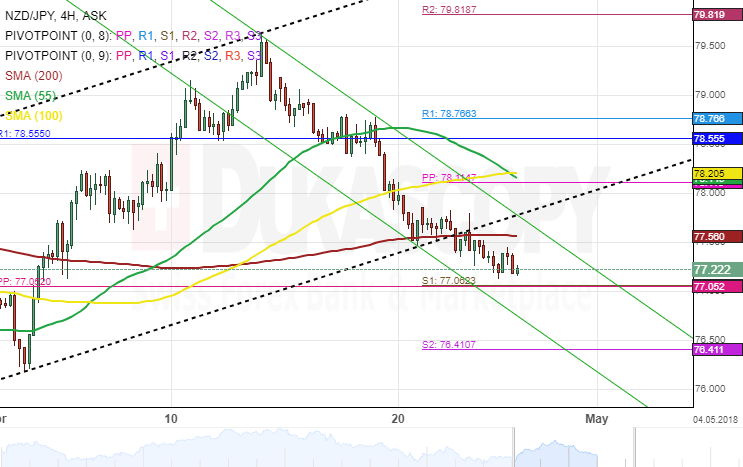
The New Zealand Dollar has been trading in an ascending channel against the Japanese Yen since late March. However, after the currency pair hit the upper boundary of a junior channel, the pair began to decline.
Given that a breakout had occurred through the bottom border of this pattern, it is expected that the NZD/JPY exchange rate could be set for a long-term decline.
Moreover, the simple moving averages have provided the sell signals. The pair has breached both the 55-, 100-, and the 200– hour SMAs.
Technical indicators suggest that bears are likely to grow stronger during the following trading session. Nevertheless, it is important to point that a support cluster set by the combination of the weekly and the monthly near the 77.21 regions might prevent the rate from falling.