
A note on lower timeframe confirming price action…
Waiting for lower timeframe confirmation is our main tool to confirm strength within higher timeframe zones, and has really been the key to our trading success. It takes a little time to understand the subtle nuances, however, as each trade is never the same, but once you master the rhythm so to speak, you will be saved from countless unnecessary losing trades. The following is a list of what we look for:
- A break/retest of supply or demand dependent on which way you’re trading.
- A trendline break/retest.
- Buying/selling tails … essentially we look for a cluster of very obvious spikes off of lower timeframe support and resistance levels within the higher timeframe zone.
- Candlestick patterns. We tend to only stick with pin bars and engulfing bars as these have proven to be the most effective.
EUR/USD
Weekly gain/loss: – 67 pips
Weekly closing price: 1.0589
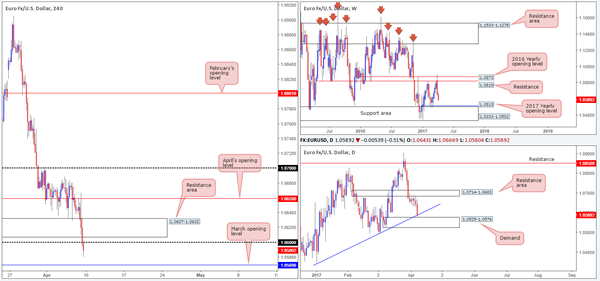
Last week’s action shows that the EUR/USD extended its pullback from the 2016 yearly opening level at 1.0873, which could force the major to test the 2017 yearly opening level at 1.0515/support area at 1.0333-1.0502 sometime this week. With this area having been a considerable support and resistance zone in this market since late 1997, selling pressure is expected to diminish here.
Despite weekly price indicating further downside may be on the cards, daily action is seen testing a trendline support etched from a low of 1.0340, which happens to be positioned directly above a demand base at 1.0525-1.0576. While this area has a good chance of repelling price, it may be worth taking into consideration that the mentioned 2017 yearly opening level sits just beneath here, thus, a fakeout through this zone is a real possibility.
Following Friday’s lower-than-expected US non-farm payrolls print at 98k, a slightly upbeat unemployment rate at 4.5% and average hourly earnings coming in as expected at 0.2%, the single currency aggressively spiked northbound and tested April’s opening level at 1.0659. As can be seen on the H4 chart, buyers failed to sustain gains beyond this point and ended the day touching fresh lows beyond the 1.06 handle.
Our suggestions: A long from March’s opening level seen at 1.0569 is certainly something to consider, given how it fuses with the nearby daily trendline support/daily demand area. With this being said however, there are two cautionary points to consider. Firstly, as explained above, the weekly chart suggests further selling could be seen. Secondly, there is little H4 structure seen around March’s opening line. The closest place for stops here, in our view, is beyond the 9th March low at 1.0525! Therefore, in order to trade from here, we would advise waiting for a reasonably sized H4 bull candle to take shape, and place stops beyond its tail. The first take-profit from this angle can be seen at 1.06, followed closely by the resistance area planted at 1.0607-1.0632.
Data points to consider: Fed Chair Yellen speaks at the University of Michigan at 9.10pm GMT.
Levels to watch/live orders:
- Buys: 1.0569 region ([waiting for a reasonably sized H4 bullish candle to form before pulling the trigger is advised] stop loss: ideally beyond the trigger candle’s tail).
- Sells: Flat (stop loss: N/A).
GBP/USD
Weekly gain/loss: – 177 pips
Weekly closing price: 1.2369
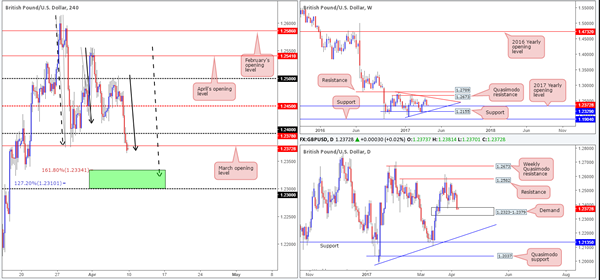
Breaking a three-week bullish phase, weekly bears rose up and took charge last week bringing the pound to within striking distance of the 2017 yearly opening level at 1.2329. Also of particular interest on the weekly timeframe is the potential bearish pennant currently in motion (1.2774/1.1986).
Climbing down to the daily candles, we can clearly see that the 2017 yearly opening level mentioned above is housed within the lower extremes of a daily demand base pegged at 1.2323-1.2379. This area held price beautifully on the 29th March, so we may see history repeat itself here.
Disappointing manufacturing and industrial production out of the UK on Friday sent the pair below the H4 mid-level support 1.2450. Further downside was seen shortly after this despite US non-farm payrolls coming in lower than expected. The week ended with the H4 candles closing beyond March’s opening level at 1.2378.
Our suggestions: To make a long story short, we are currently interested in the 1.23/1.2334 (green) region for longs on the H4 chart. The reasons for why are as follows:
- There’s a H4 AB=CD (filled arrows) 161.8% Fib ext. at 1.2334 taken from the high 1.2556. This denotes the top edge of our buy zone.
- There’s also a H4 AB=CD (dashed arrows) 127.2% Fib ext. at 1.2310 drawn from the high 1.2615.
- A psychological barrier at 1.23, which represents the lower limit of our buy zone.
- Although this H4 buy zone slightly surpasses the daily demand at 1.2323-1.2379, we still consider this to be a plus point having this area involved.
- Housed within the buy zone and the daily demand area we have the 2017 yearly opening level at 1.2329.
To avoid any fakeout beyond 1.23, however, one may want to consider waiting for a reasonably sized H4 bullish candle to form prior to pressing the buy button. Stops can then be placed beyond this trigger candle.
Data points to consider: Fed Chair Yellen speaks at the University of Michigan at 9.10pm GMT.
Levels to watch/live orders:
- Buys: 1.23/1.2334 ([waiting for a reasonably sized H4 bullish candle to form before pulling the trigger is advised] stop loss: ideally beyond the trigger candle’s tail).
- Sells: Flat (stop loss: N/A).
AUD/USD
Weekly gain/loss: – 126 pips
Weekly closing price: 0.7501
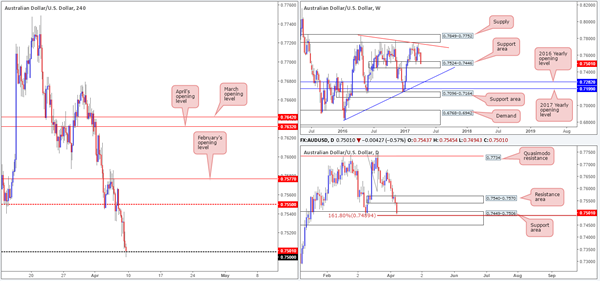
The commodity currency shredded over 100 pips last week, consequently forming a strong full-bodied weekly bearish candle. What’s also notable from the weekly timeframe is that price shook hands with a support area at 0.7524-0.7446, which can be seen stretching as far back as mid-2016.
Also noteworthy on the daily timeframe is the unit crossed swords with a support area at 0.7449-0.7506. Housed within the noted weekly support area and also bolstered by a daily AB=CD (taken from the high 0.7749) 161.8% Fib ext. at 0.7489, this certainly places the bulls in a favorable position this week.
A quick recap of Friday’s trading on the H4 chart shows that the Aussie tumbled down to the 0.75 handle going into the closing bell, even though US non-farm payrolls came in much lower than expected. Given that 0.75 is positioned within both the mentioned higher-timeframe support areas, we do expect to see some buying pressure emerge from here.
Our suggestions: Psychological handles are, in our humble opinion, prone to fakeouts. Seeing as how there’s a 161.8% daily Fib ext. at 0.7489 lurking just 11 pips below this number, we are, therefore, anticipating a fakeout below 0.75 before buying is seen.
Should this come to fruition, and a decisive H4 close is seen back above 0.75, this would be considered a strong signal that the bulls are taking control here and may look to pull price back up to the 0.7550 neighborhood.
Data points to consider: Fed Chair Yellen speaks at the University of Michigan at 9.10pm GMT.
Levels to watch/live orders:
- Buys: Wait and see if price tests the 0.7489 level and closes back above 0.75 on the H4 chart. This is, in our view, evidence enough to justify a long position (stop loss: ideally beyond the trigger candle’s tail).
- Sells: Flat (stop loss: N/A).
USD/JPY
Weekly gain/loss: – 31 pips
Weekly closing price: 111.05
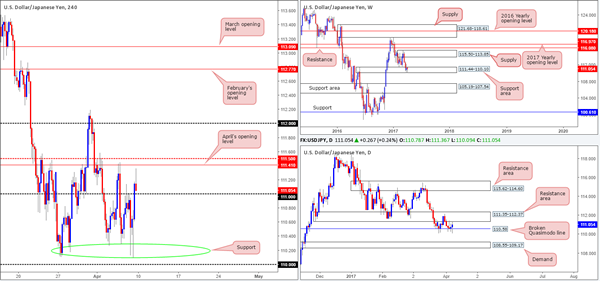
As can be seen from the weekly chart this morning, the pair continues to defend the support area at 111.44-110.10. In the event that the bulls maintain their presence here, the supply seen overhead at 115.50-113.85 will likely be the next area in the firing range. A violation of the current support area on the other hand, could set the stage for a downside move to another support area pegged at 105.19-107.54.
The story on the daily chart, nevertheless, shows that since the 23rd March the candles have been ranging between a resistance area at 111.35-112.37 and a broken Quasimodo line at 110.58. Therefore, until the resistance area is taken out we would be wary of committing to any intermediate-term buys at the moment.
The impact of Friday’s disappointing non-farm payrolls data triggered an aggressive downside move to lows of 110.09. However, as you can see, there was little follow through generated after this, with price wrapping up the week closing above the 111 handle.
Our suggestions: In view of the daily range this is a challenging market to trade, in our opinion. The only area that really sparks interest this morning is April’s opening level at 111.41, shadowed closely by the H4 mid-way resistance at 111.50 and the underside of the daily resistance mentioned above at 111.35. Before committing to a trade from here, we would require some form of lower-timeframe confirming sell signal (see the top of this report), since let’s not forget that by shorting here, you’re going against potential weekly buyers!
Data points to consider: Fed Chair Yellen speaks at the University of Michigan at 9.10pm GMT.
Levels to watch/live orders:
- Buys: Flat (stop loss: N/A).
- Sells: 111.50/111.41 region: ([waiting for a lower-timeframe confirming signal to form is advised] stop loss: dependent on where one confirms the area).
USD/CAD
Weekly gain/loss: + 89 pips
Weekly closing price: 1.3406
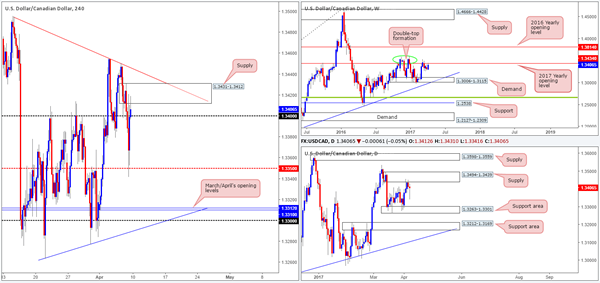
Weekly price has spent the best part of a month teasing the underside of the 2017 yearly opening level at 1.3434. Reinforcing this line is a well-defined double-top formation seen around the 1.3588 neighborhood (green circle). To the downside the next area of interest is a demand coming in at 1.3006-1.3115. A decisive push above the yearly level, however, could spark a round of buying up to the 2016 yearly opening level at 1.3814.
In conjunction with the 2017 yearly opening level there’s a daily supply planted at 1.3494-1.3439 currently in motion. This is the first time this area has been tested and is so far holding firm. Should the bears continue to defend this barrier the next support area in the spotlight can be seen at 1.3263-1.3301.
On Friday, the loonie fell sharply following a poor US non-farm payrolls report, and a rather upbeat Canadian employment print. Despite this, the H4 mid-way support at 1.3350 stepped in and provided a floor for the buyers to neutralize this move! This saw the market close just above 1.34 and tag the nearby H4 supply at 1.3431-1.3412.
Our suggestions: As of the week’s close, neither a long nor short seems attractive at the moment. To confirm short-term direction on the H4, we would need to see price either close above the current supply or push back below the 1.34 line.
Ultimately, given the position of weekly and daily price, we would prefer to see a close below 1.34. This would likely confirm strength from the noted higher-timeframe structures and potentially allow one to short down to 1.3350 on any retest seen to the underside of 1.34.
Data points to consider: Fed Chair Yellen speaks at the University of Michigan at 9.10pm GMT.
Levels to watch/live orders:
- Buys: Flat (stop loss: N/A).
- Sells: Watch for price to close back below 1.34 and then look to trade any successful retest thereafter (stop loss: ideally beyond the trigger candle’s wick).
USD/CHF
Weekly gain/loss: + 64 pips
Weekly closing price: 1.0090
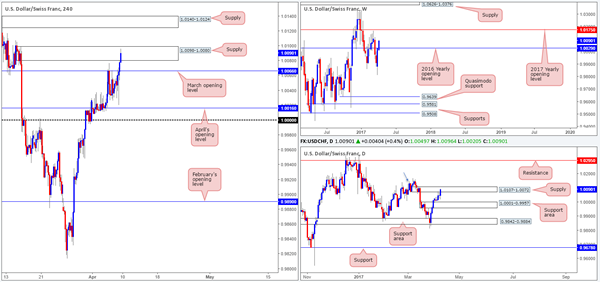
The Swissy, as you can see, managed to close above the 2016 yearly opening level at 1.0029 last week, following an extension of the previous week’s run from weekly lows of 0.9813. A continuation move north from here could see price fake above the 6th March high at 1.0170 and unite with the 2017 yearly opening level at 1.0175.
Before the weekly buyers can lift price higher, nonetheless, daily supply at 1.0107-1.0072 will need to be consumed. Of course, a break above here will not automatically guarantee that price will rally to 1.0175, since there is a daily Quasimodo left shoulder seen marked with a blue arrow at 1.0146.
Friday’s US employment report was a relatively mixed bag, with non-farm payrolls coming in much lower than expected at 98k! The aftermath saw an instant spike to lows of 1.0020, just a few pips ahead of April’s opening level at 1.0016. The sellers clearly ran out of steam by this point as price reversed tracks and ended the week taking out March’s opening line at 1.0066 and testing a H4 supply zone picked at 1.0098-1.0080.
Our suggestions: While we feel weekly price will drag this unit higher throughout the week, taking a long on the basis of this would be risky as there’s both a H4 and daily supply currently in play! Given this factor, our desk has decided to hold fire today and wait and see if the daily bulls can print a close above the noted supply zone, before thinking about longs.
Data points to consider: Fed Chair Yellen speaks at the University of Michigan at 9.10pm GMT.
Levels to watch/live orders:
- Buys: Flat (stop loss: N/A).
- Sells: Flat (stop loss: N/A).
DOW 30
Weekly gain/loss: – 12 points
Weekly closing price: 20657
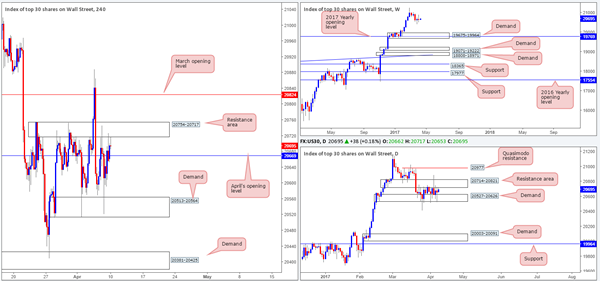
US equities are effectively unchanged this week, despite the index ranging 370 points! Right now, there is very little weekly structure seen until the index crosses swords with demand at 19675-19964, which happens to intersect with the 2017 yearly opening level at 19769.
Since the 22nd March, the daily candles have experienced a significant amount of choppy action between demand plugged at 20527-20626 and the resistance area at 20714-20821. A violation of this demand would likely open up the path south down to demand pegged at 20003-20091 (located just above the aforementioned weekly demand and daily support at 19964). A push above the resistance area, however, would likely place the Quasimodo resistance at 20977 in the limelight.
Jumping across to the H4 chart, we can see that price is teasing the underside of a resistance area seen at 20754-20717. Although this could encourage further selling, April’s opening level at 20669 is seen relatively nearby and could potentially throw a spanner in the works.
Our suggestions: Neither a long nor short seems attractive at this time. As such, our desk has noted that they would like to see daily price breach its current range before trading this market.
Data points to consider: Fed Chair Yellen speaks at the University of Michigan at 9.10pm GMT.
Levels to watch/live orders:
- Buys: Flat (stop loss: N/A).
- Sells: Flat (stop loss: N/A).
GOLD:
Weekly gain/loss: + $6.9
Weekly closing price: 1254.9
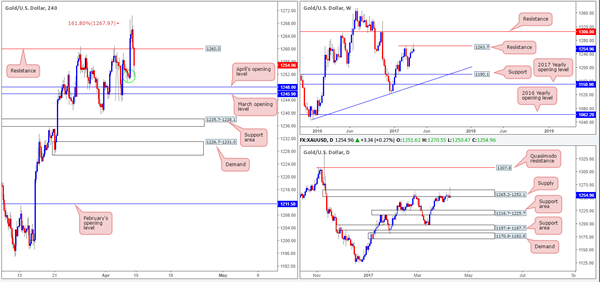
Weekly buyers printed their fourth consecutive weekly gain last week and managed to touch gloves with a weekly resistance level fixed at 1263.7. The week’s close, as you can probably see, chalked up a nice-looking selling wick that could very well encourage shorts to come in a break lower.
In line with weekly flow, we can see that daily action drew in a selling wick within the walls of a supply zone at 1265.2-1252.1. This – coupled with weekly structure, could send the unit down to the support area marked at 1216.7-1225.7.
Over on the H4 candles, H4 flow is seen testing a minor demand base marked with a green circle at 1249.5-1251.6, following a selloff from the H4 161.8% Fib ext. at 1267.9 (taken from the low 1243.6). Given the higher-timeframe structure, and the fact that there are two monthly levels sitting directly below (April and March’s opening lines at 1245.9/1248.0); we have absolutely no interest in trying to go long from the demand base!
Our suggestions: Although H4 price will likely bounce from between the two noted monthly levels, we would feel uncomfortable taking a position here simply because of where price is located on the bigger picture! In essence, our plan of action going into today’s segment is to sit tight and reassess going into tomorrow’s open.
Levels to watch/live orders:
- Buys: Flat (stop loss: N/A).
- Sells: Flat (stop loss: N/A).


