
Key Highlights
- The US Dollar corrected lower after trading as high as 110.01 against the Japanese Yen.
- There is a crucial bullish trend line formed with support 109.15 on the 4-hour chart of USD/JPY.
- The US Consumer Price Index in April 2018 posted a rise of 0.2%, less than the +0.3% forecast (MoM).
- Today, Canada’s Net Employment Change for April 2018 will be released, which is forecasted to post 17.4K.
USDJPY Technical Analysis
The US Dollar remained in a decent uptrend above 108.50 this week against the Japanese Yen. The USD/JPY pair traded a few pips above 110.00 before starting a downside correction.
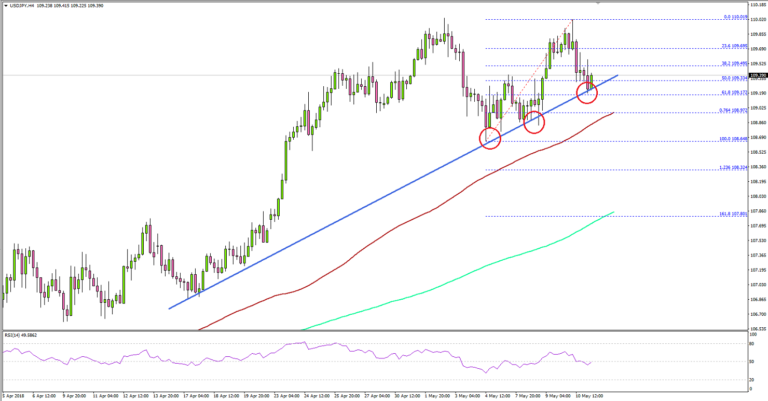
It declined and traded below the 23.6% Fib retracement level of the last wave from the 108.64 low to 110.01 high. It seems like there were two rejections from the 110.00 resistance level, which ignited the current downside reaction.
However, on the downside, there is a crucial bullish trend line formed with support 109.15 on the 4-hour chart of USD/JPY. Moreover, the 61.8% Fib retracement level of the last wave from the 108.64 low to 110.01 high is at 109.17, acting as a support.
Therefore, as long as the pair is above 109.00-15, it remains supported for more gains. A break below this last could push the pair towards the 108.50 support. On the upside, an initial resistance is at 109.80, followed by the all-important 110.00 level.
Recently, the US Consumer Price Index for April 2018 was released by the US Bureau of Labor Statistics. The market was looking for a rise of 0.3% in the CPI in April 2018 compared with the previous month.
However, the actual result was a bit lower, as the CPI increased 0.2%. In terms of the yearly change, there was a rise of 2.5%, similar to the forecast. Moreover, the Consumer Price Index (CPI) Ex Food & Energy came in at 2.1%, less than the forecast of 2.2%.
The report added that:
The indexes for gasoline and shelter were the largest factors in the seasonally adjusted increase in the all items index, although the food index increased as well. The gasoline index increased 3.0 percent, more than offsetting declines in other energy component indexes and led to a 1.4-percent rise in the energy index.
Overall, the pair has to stay above the 109.00 level to avoid more losses. In the short term, there could be ranging moves above 109.00 before the next move.
Economic Releases to Watch Today
- US Import Price Index April 2018 (MoM) – Forecast +0.5%, versus 0.0% previous.
- US Export Price Index April 2018 (MoM) – Forecast +0.3%, versus +0.3% previous.
- Canada’s employment Change payrolls April 2018 – Forecast 17.4K, versus 32.3K previous.
- Canada’s Unemployment Rate April 2018 – Forecast 5.8%, versus 5.8% previous.


